SAMBA: Standardized and Automated MetaBarcoding Analyses workflow
Description of the workflow
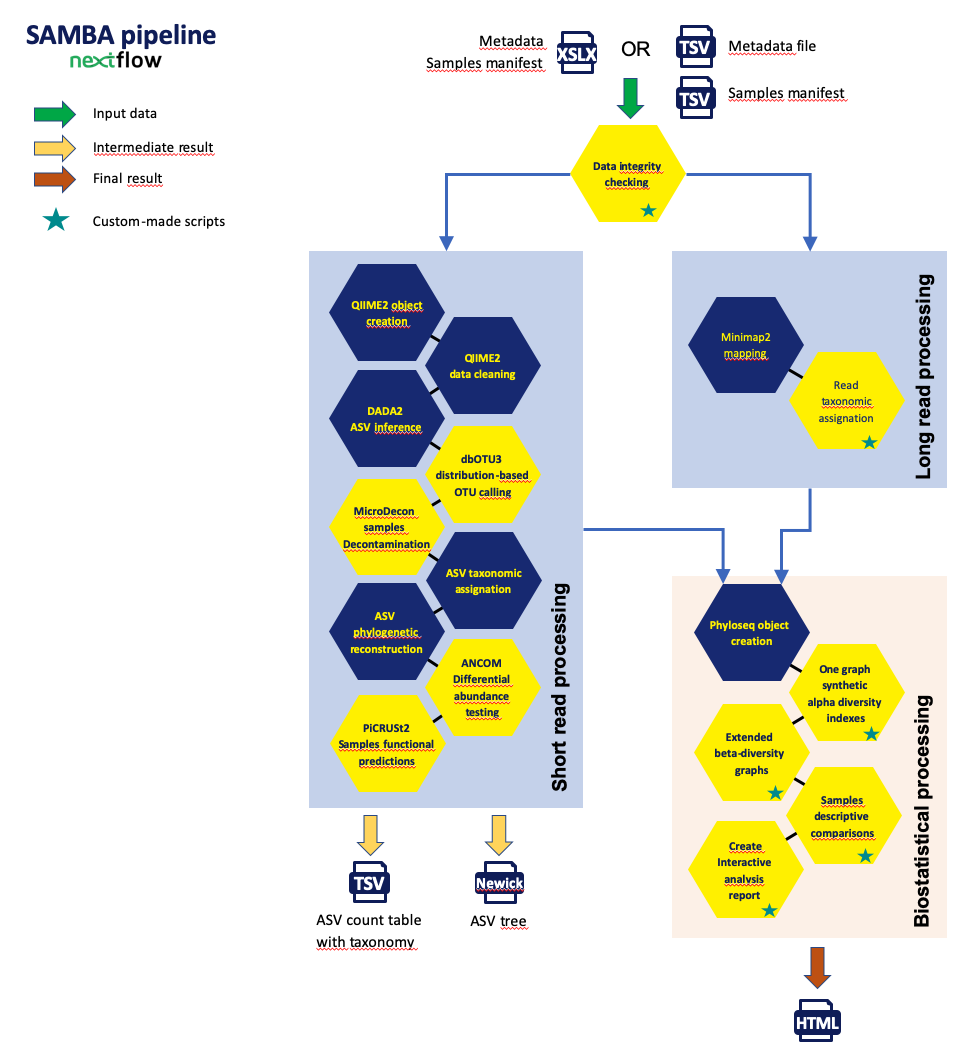
The SAMBA workflow, developed by the SeBiMER (Ifremer's Bioinformatics Core Facility) is an open-source modular workflow
to process eDNA metabarcoding data. SAMBA is developped using the NextFlow workflow manager (Di Tommaso et al., 2017). SAMBA is built
around three main parts: data integrity checking, bioinformatics processes and statistical analyses. The SAMBA checking process
allows to verify the integrity of the raw data. All bioinformatics processes are mainly based on the use of the next-generation
microbiome bioinformatics platform QIIME 2 (Bolyen et al., 2019 ; version 2020.2) and on the approach of grouping
sequences in ASV (Amplicon Sequence Variants) using DADA2 (Callahan et al., 2016). It also performs extensives analyses
of the alpha- and beta-diversity using homemade R scripts (R CORE TEAM, 2020). SAMBA offers a real alternative to the complex use of
a suite of command line bioinformatics tools while providing access to state-of-the-art methods and tools in the field.
The SAMBA source code, documentation and installation instructions are freely available at SeBiMER GitHub.
In order to achieve the complete analysis, SAMBA uses a range of state-of-the-art software and methods which you will find the list below :
| Tools and softwares | Version |
|---|---|
| SAMBA | v3.0.1 |
| Required | |
| Nextflow | 20.04.1 |
| Included in SAMBA | |
| QIIME 2 | 2019.10.0 |
| R | 3.6.1 |
| DESeq2 | 1.26.0 |
| metagenomeSeq | 1.28.0 |
| microbiome | 1.8.0 |
| phyloseq | 1.30.0 |
| vegan | 2.5.6 |
| UpSetR | 1.4.0 |
Bioinformatic process
Data integrity [optional]
This first step allows to analyze the integrity of your data in order to identify
potential problems related to the sequencing processes. It checks:
- that each read is correctly associated with the proper sample (sequence barcode verification)
- that they come from a single sequencer
- the efficiency of forward and reverse PCR amplification
Results
- All data integrity verification are summarized in this csv file
Importing raw data
The step performs the import of sequencing data directly from DATAREF into
a QIIME 2 specific format. In addition, descriptive statistics of your data are generated
. The SAMBA workflow ran for you the following commands
Results
Output folder
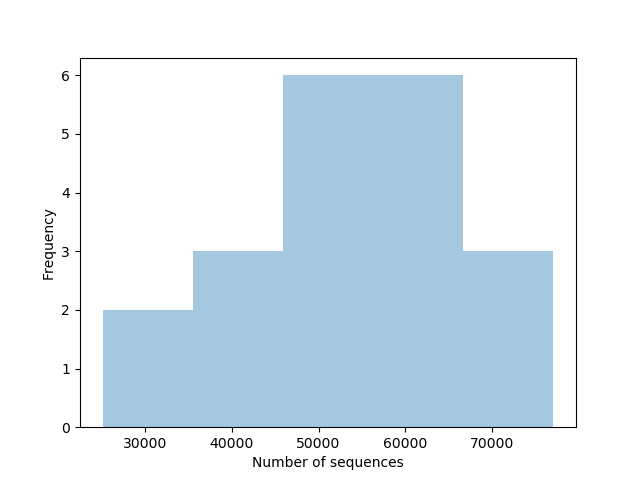
- Sample repartition according to the sequence count
- All descriptive statistics of your samples are available here (html output)
Primers removal
The third step is to remove the primers using the cutadapt plugin available in
QIIME 2. In addition, descriptive statistics of your data are generated.
The following commands made this step possible using the parameters that you have
defined in the parameters configuration file :
User-defined Cutadapt parameters
- Mode: Paired-end
- Forward primer sequence: ACGGRAGGCAGCAG
- Reverse primer sequence: TACCAGGGTATCTAATCCT
- Overlap: 13
- Error rate: 0.1
Results
Output folder
- Sample repartition according to the sequence count

- All descriptive statistics of your samples after the trimming are available here (html output)
- The quality of your data before any quality filtering step is viewable here (html output)
Sequence quality control and feature table construction
The following step of the workflow is to filter the quality of the sequences according
to the parameters defined yourself by having considered the quality of your data in the
previous step. Also to assemble the forward and reverse sequences, and to identify and remove the
chimeras. To performed this step, the DADA2 R package was used through QIIME 2
using the following commands and your parameters :
User-defined DADA2 parameters
- Mode: Paired-end
- Number of bases trimmed in 5' of forward reads: 0
- Number of bases trimmed in 5' of reverse reads: 0
- Length to trim forward reads (0 for no trimming): 0
- Length to trim reverse reads (0 for no trimming): 0
- Max error rate allowed in forward reads: 2
- Max error rate allowed in reverse reads: 2
- Minimal quality score allowed: 2
- Method for chimeras detection: consensus
Results
Output folder
- The dynamics of the different step of filtering can be visualized in this html file and are also available in a tabulated file
- Distribution of sequences in samples
- Feature details are available here (html output)
- Details about the samples can be found by going to this interactive html page
- Finally, you can retrieved the reference sequences of your ASVs in this fasta
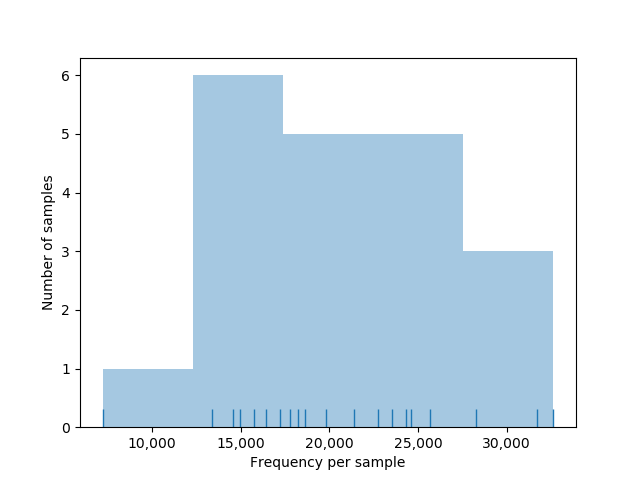
A total of 2136 ASVs was obtained at this step
ASV clustering [optional]
The following step of the workflow is to cluster ASV according to sequence similarity and
abundance profil. This allow to takes into account the overestimation of diversity
produced by DADA2. It also reduces possible PCR errors. To performed this step,
the dbOTU3 algorithm was used through QIIME 2 using the following commands and the parameters :
User-defined dbOTU3 parameters
- Genetic criterion: 0.1
- Abundance criterion: 10
- Pvalue criterion: 0.0005
Results
Output folder
- Overview of the results available here (html output)
- Feature details are available here (html output)
- Details about the samples can be found by going to this interactive html page
- Finally, you can retrieved the reference sequences of your ASVs in this fasta
A total of 1493 ASVs remain after this step. dbOTU3 allowed to cluster 643 ASVs with others ASVs (i.e. about 30.1% clustering).
Taxonomic assignation
The taxonomic assignation performed during the fourth step of the workflow allowed to
affiliate each ASV to a taxonomy by using as reference the database defined by yourself.Commands executed
User-defined QIIME 2 parameters
- Minimal confidence allowed: 0.7
- Taxonomic database used: silva_v138_16S_99_V3-V4_PCR1F460-PCR1R460.qza
Results
Output folder
Functional predictions (PICRUSt2) [optional]
This optional step allows you to predic the functional potential of the communities using PICRUSt2
User-defined PICRUSt2 parameters
- HSP method: mp
- Max nsti: 2
Results
Output folder
- EC predictions: EC metagenome predictions
- KO predictions: KO metagenome predictions
- METACYC predictions: METACYC abundance predictions
source
sample_species
source
sample_species
source
sample_species
Differential abundance testing using ANCOM
This step allows you to test if there are differentially abundant ASVs depending on the variable of interest that you have specified using the following commands :
Results
Output folder
List of all tested variables :
- sample_species
- source
ANCOM analysis based on the sample_species variable :
-
- The full analysis is available in the following directories:
ASV level ;
family level ;
genus level
- The reports generated by QIIME 2 are available by following the following links: ASV level ; family level ; genus level
- Number of significantly differentially abundant ASVs: 5 [Full list]
- Number of significantly differentially abundant family: 2 [Full list]
- Number of significantly differentially abundant genus: 3 [Full list]
ANCOM analysis based on the source variable :
-
- The full analysis is available in the following directories:
ASV level ;
family level ;
genus level
- The reports generated by QIIME 2 are available by following the following links: ASV level ; family level ; genus level
- Number of significantly differentially abundant ASVs: 7 [Full list]
- Number of significantly differentially abundant family: 4 [Full list]
- Number of significantly differentially abundant genus: 4 [Full list]
Final outputs
This is the last step of the bioinformatic process where the goal is to merge the ASV abundance table with the taxonomy file
Results
General statistical analyses
Alpha diversity [optional]
- sample_species
- source
Diversity indices
sample_species
source
Rarefaction curve
Taxonomic diversity
- Taxonomic barplots group by sample_species :
Barplot at the phylum level ; Barplot at the class level ; Barplot at the order level ; Barplot at the family level
- Taxonomic barplots group by source :
Barplot at the phylum level ; Barplot at the class level ; Barplot at the order level ; Barplot at the family level
- The results of the significance tests carried out for each variable on each diversity indexes can be viewed here
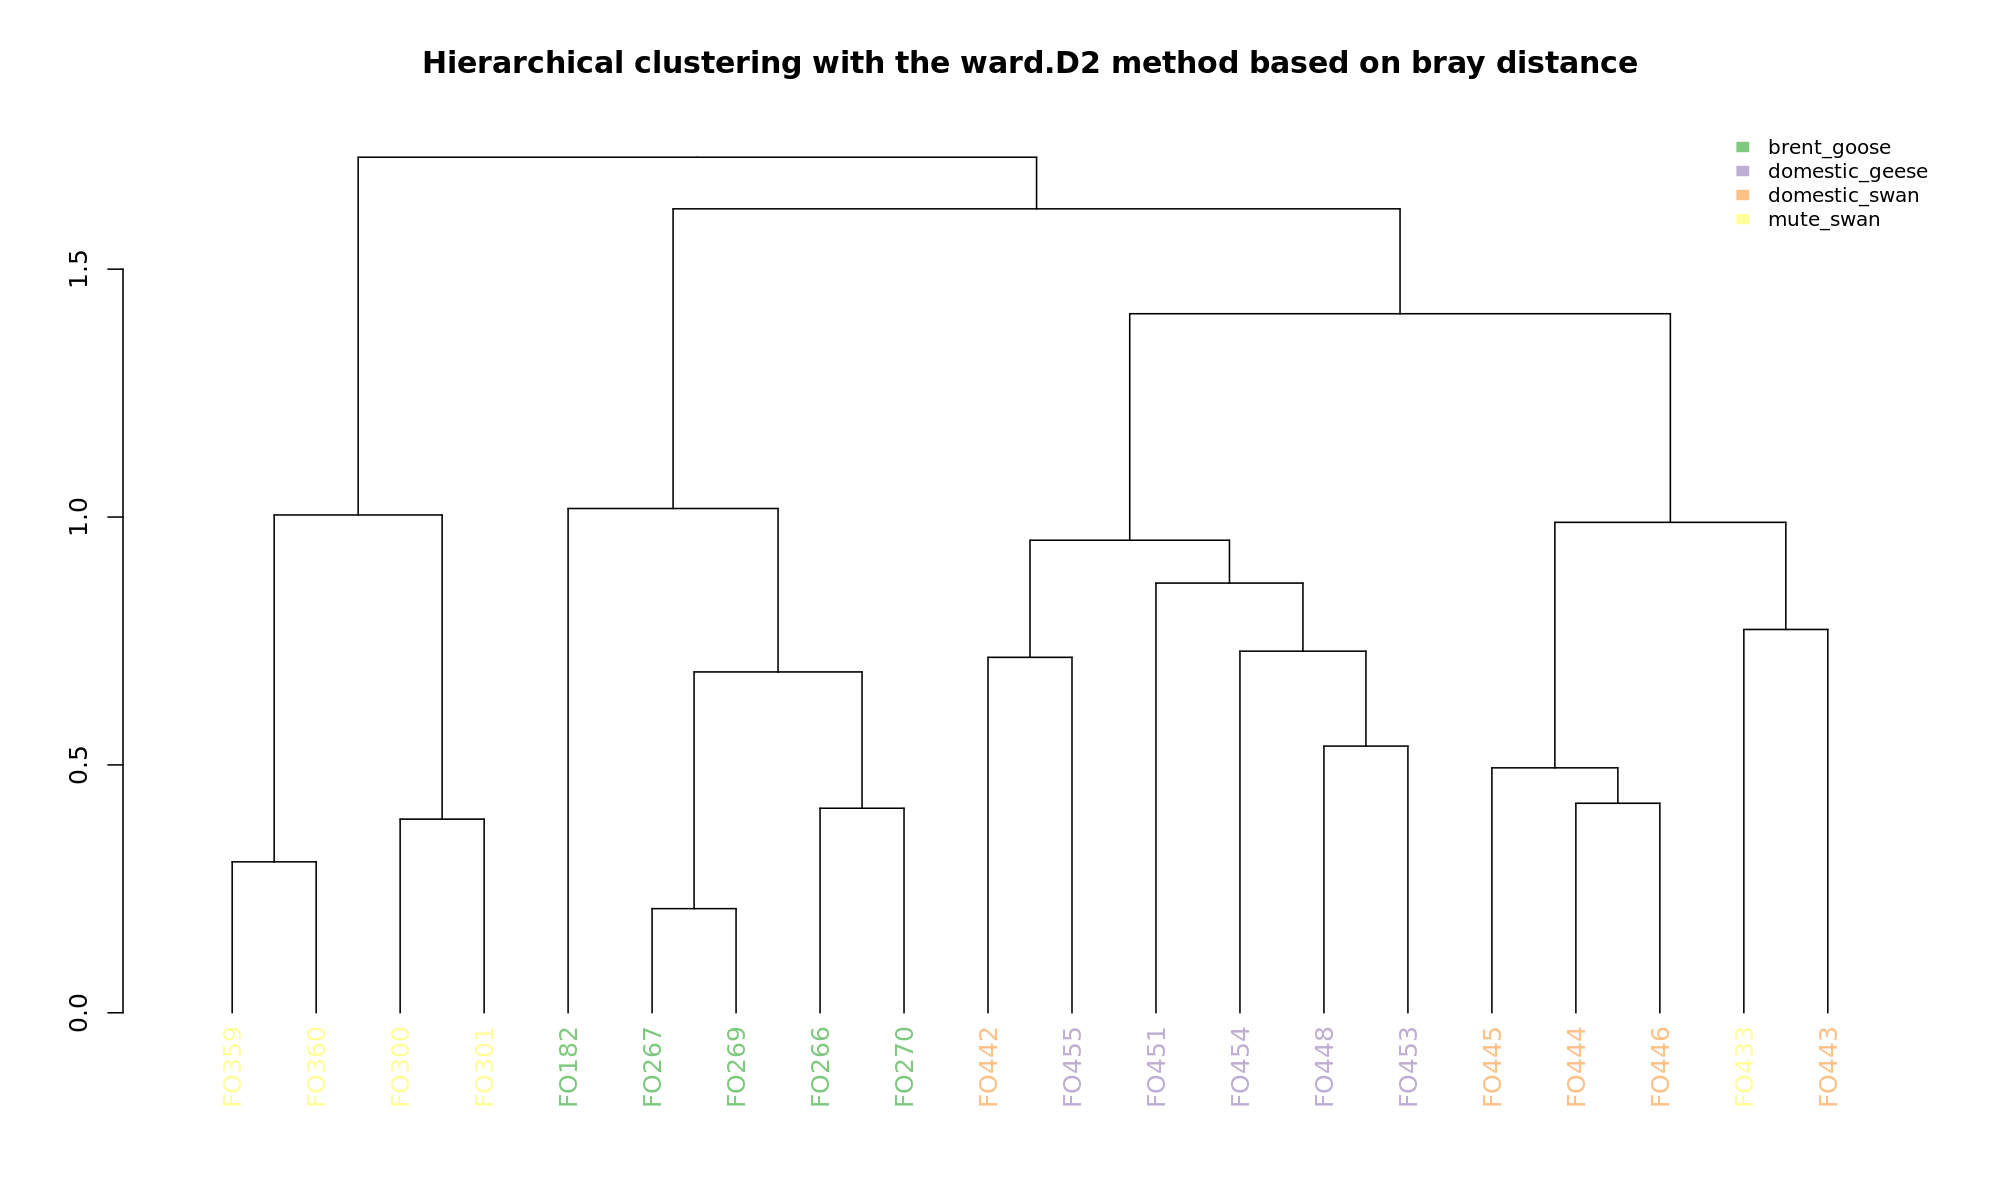
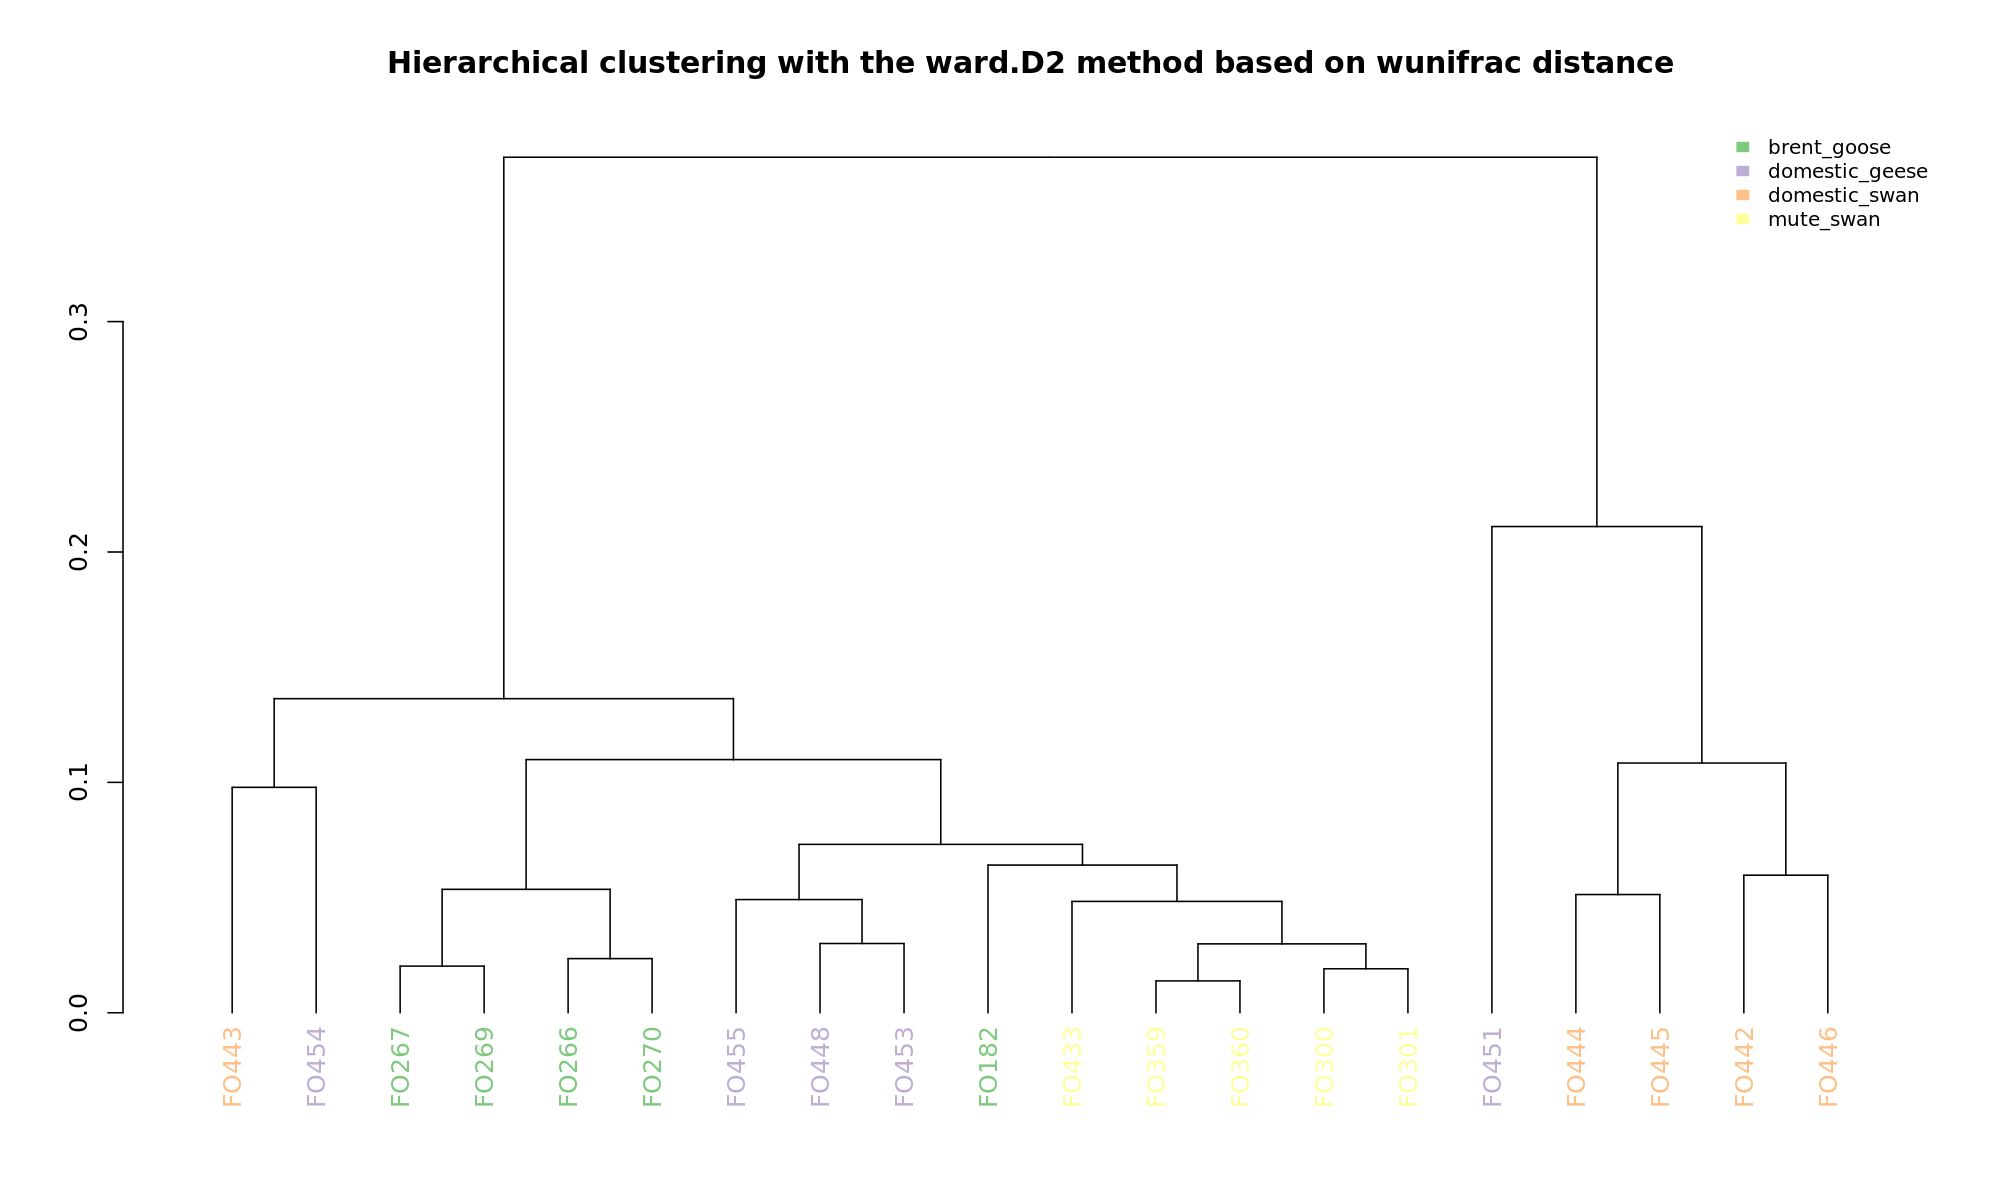
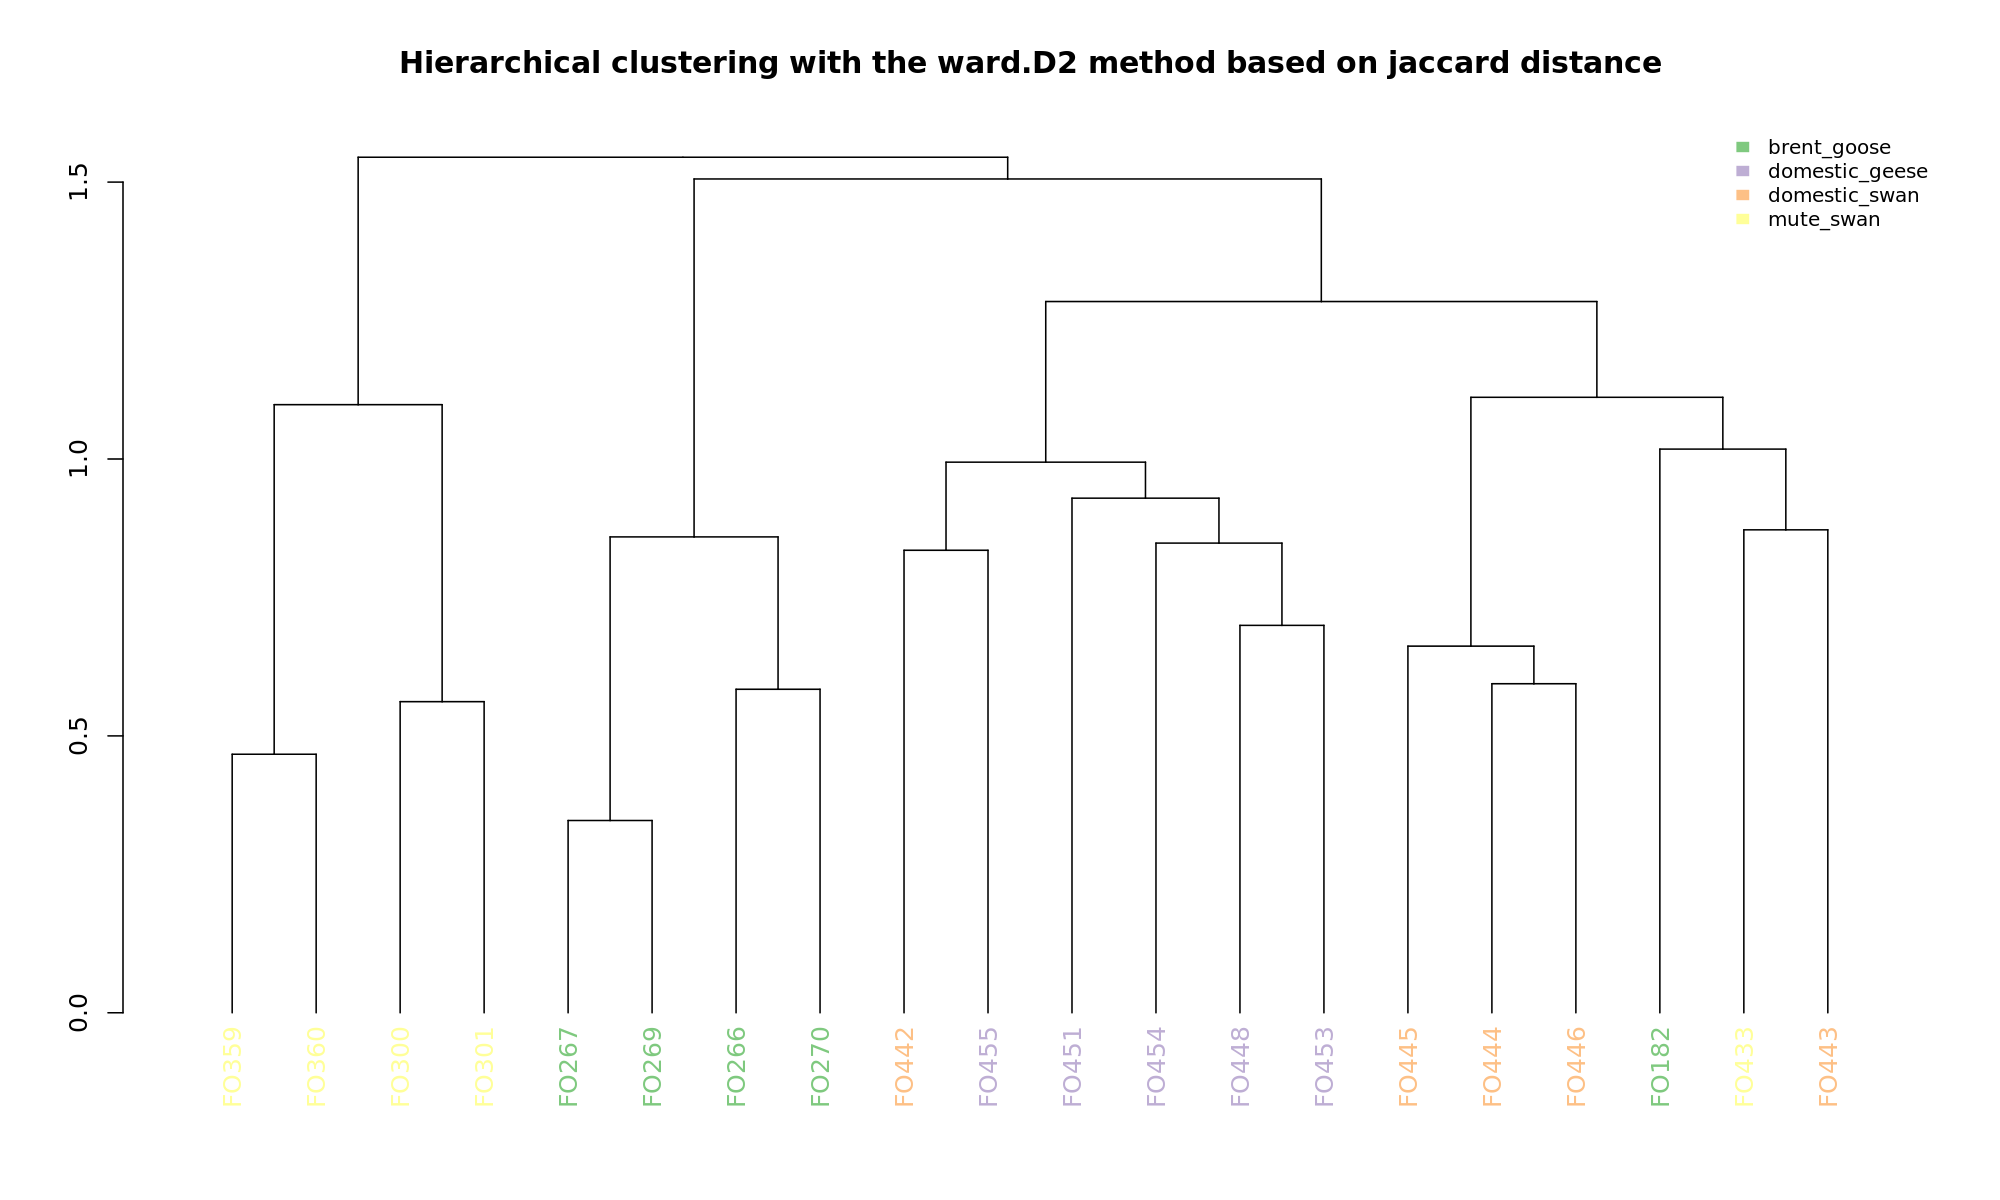
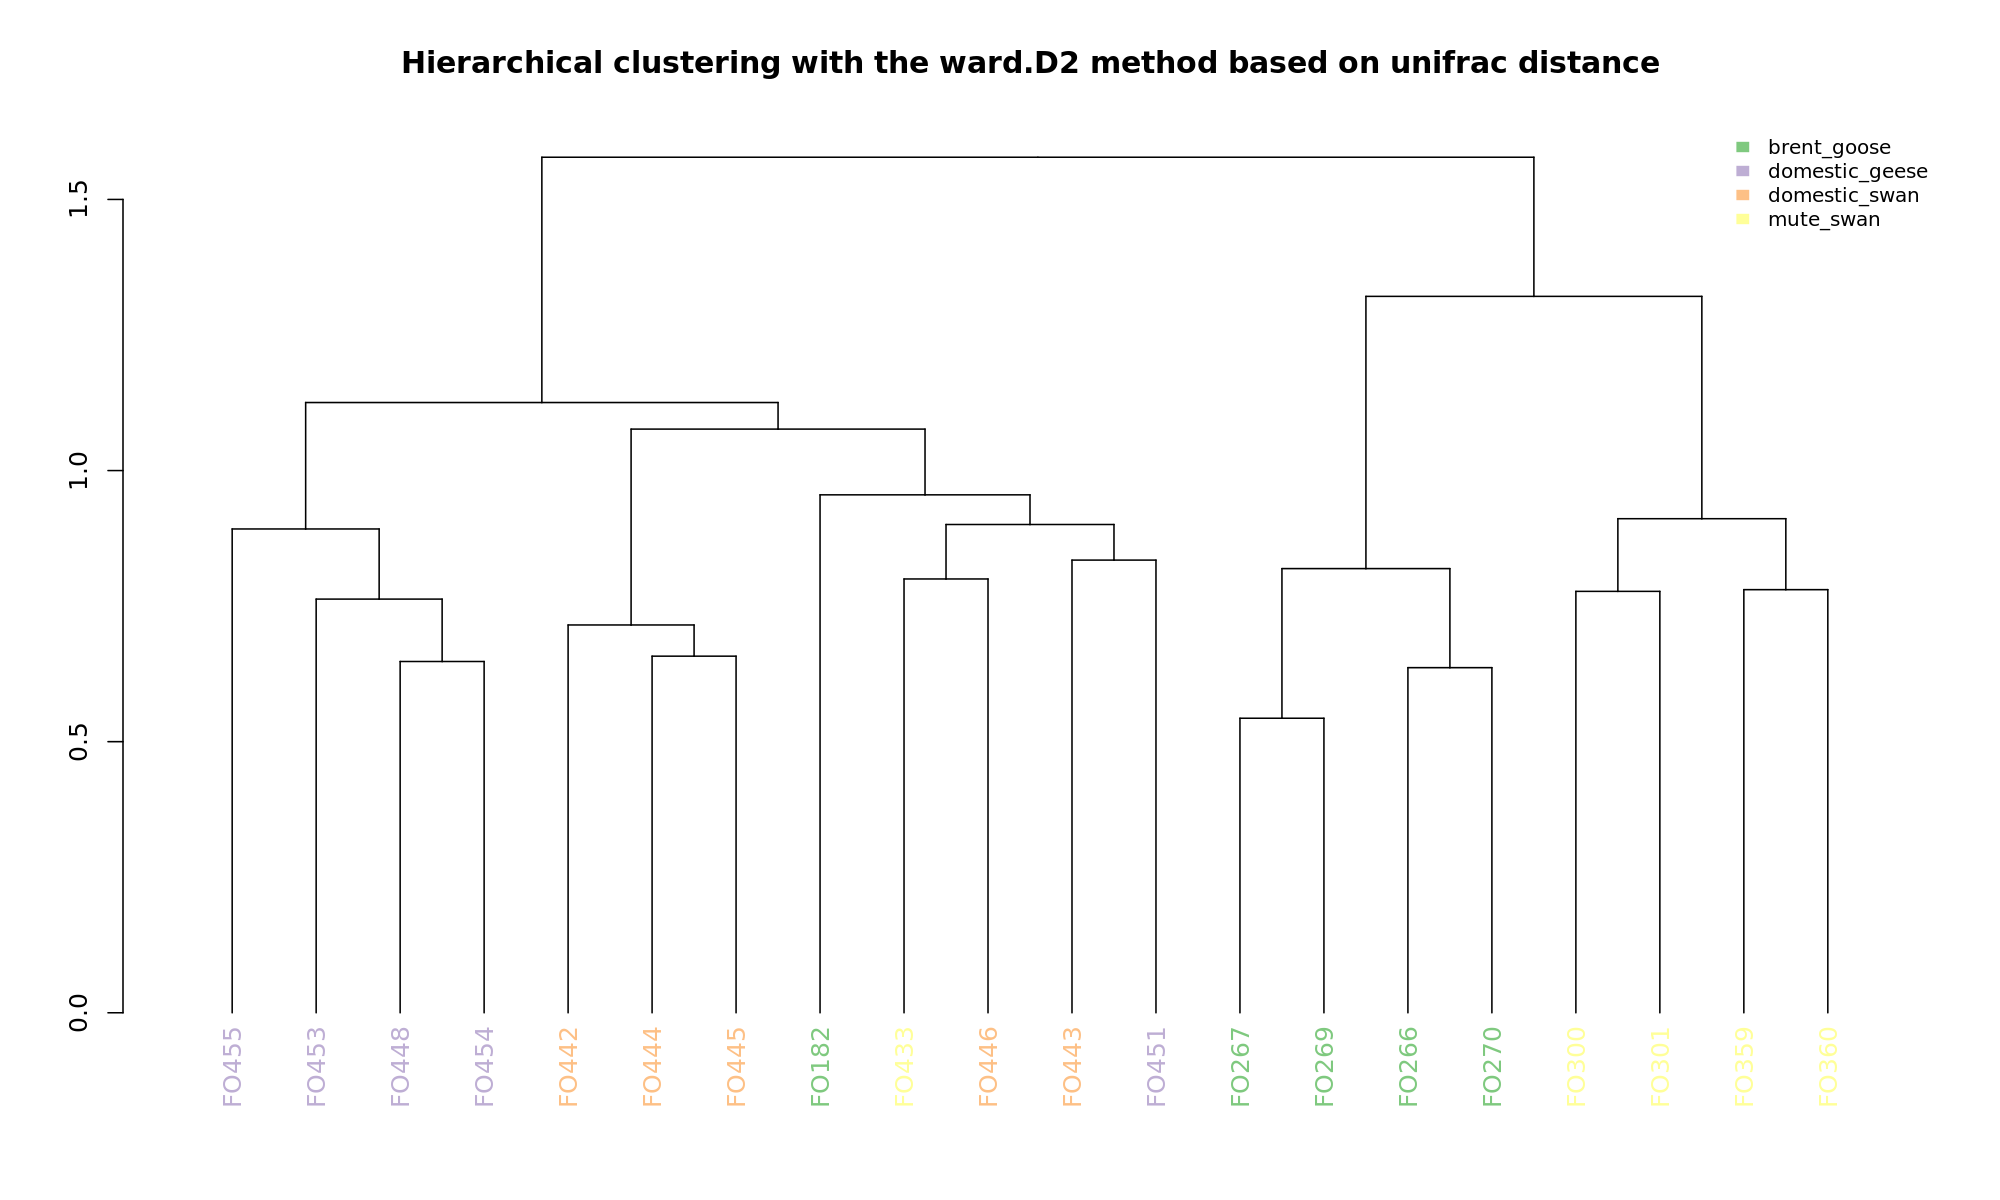
Beta diversity by index [optional]
- source
- sample_species
Beta diversity by variable [optional]
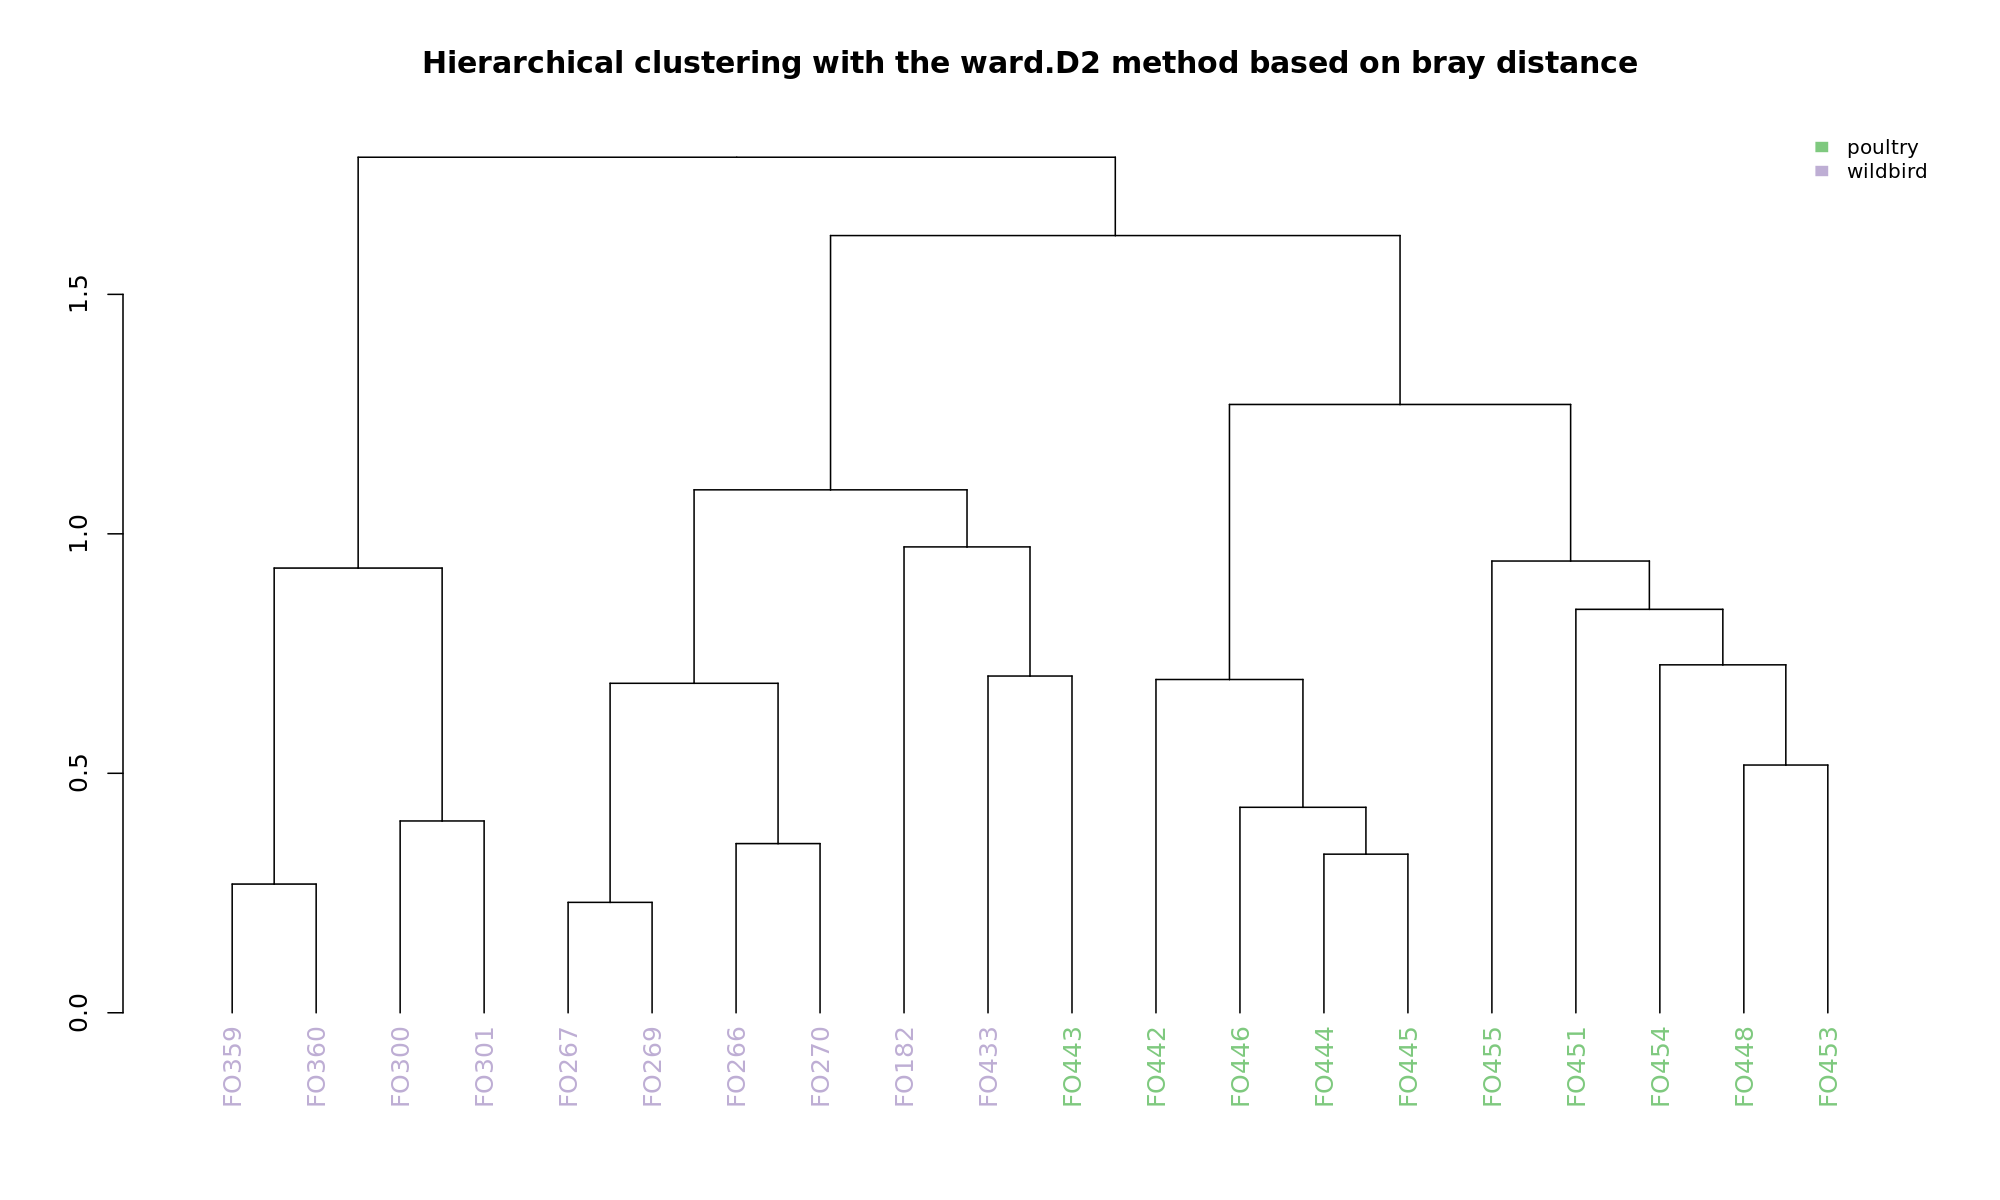
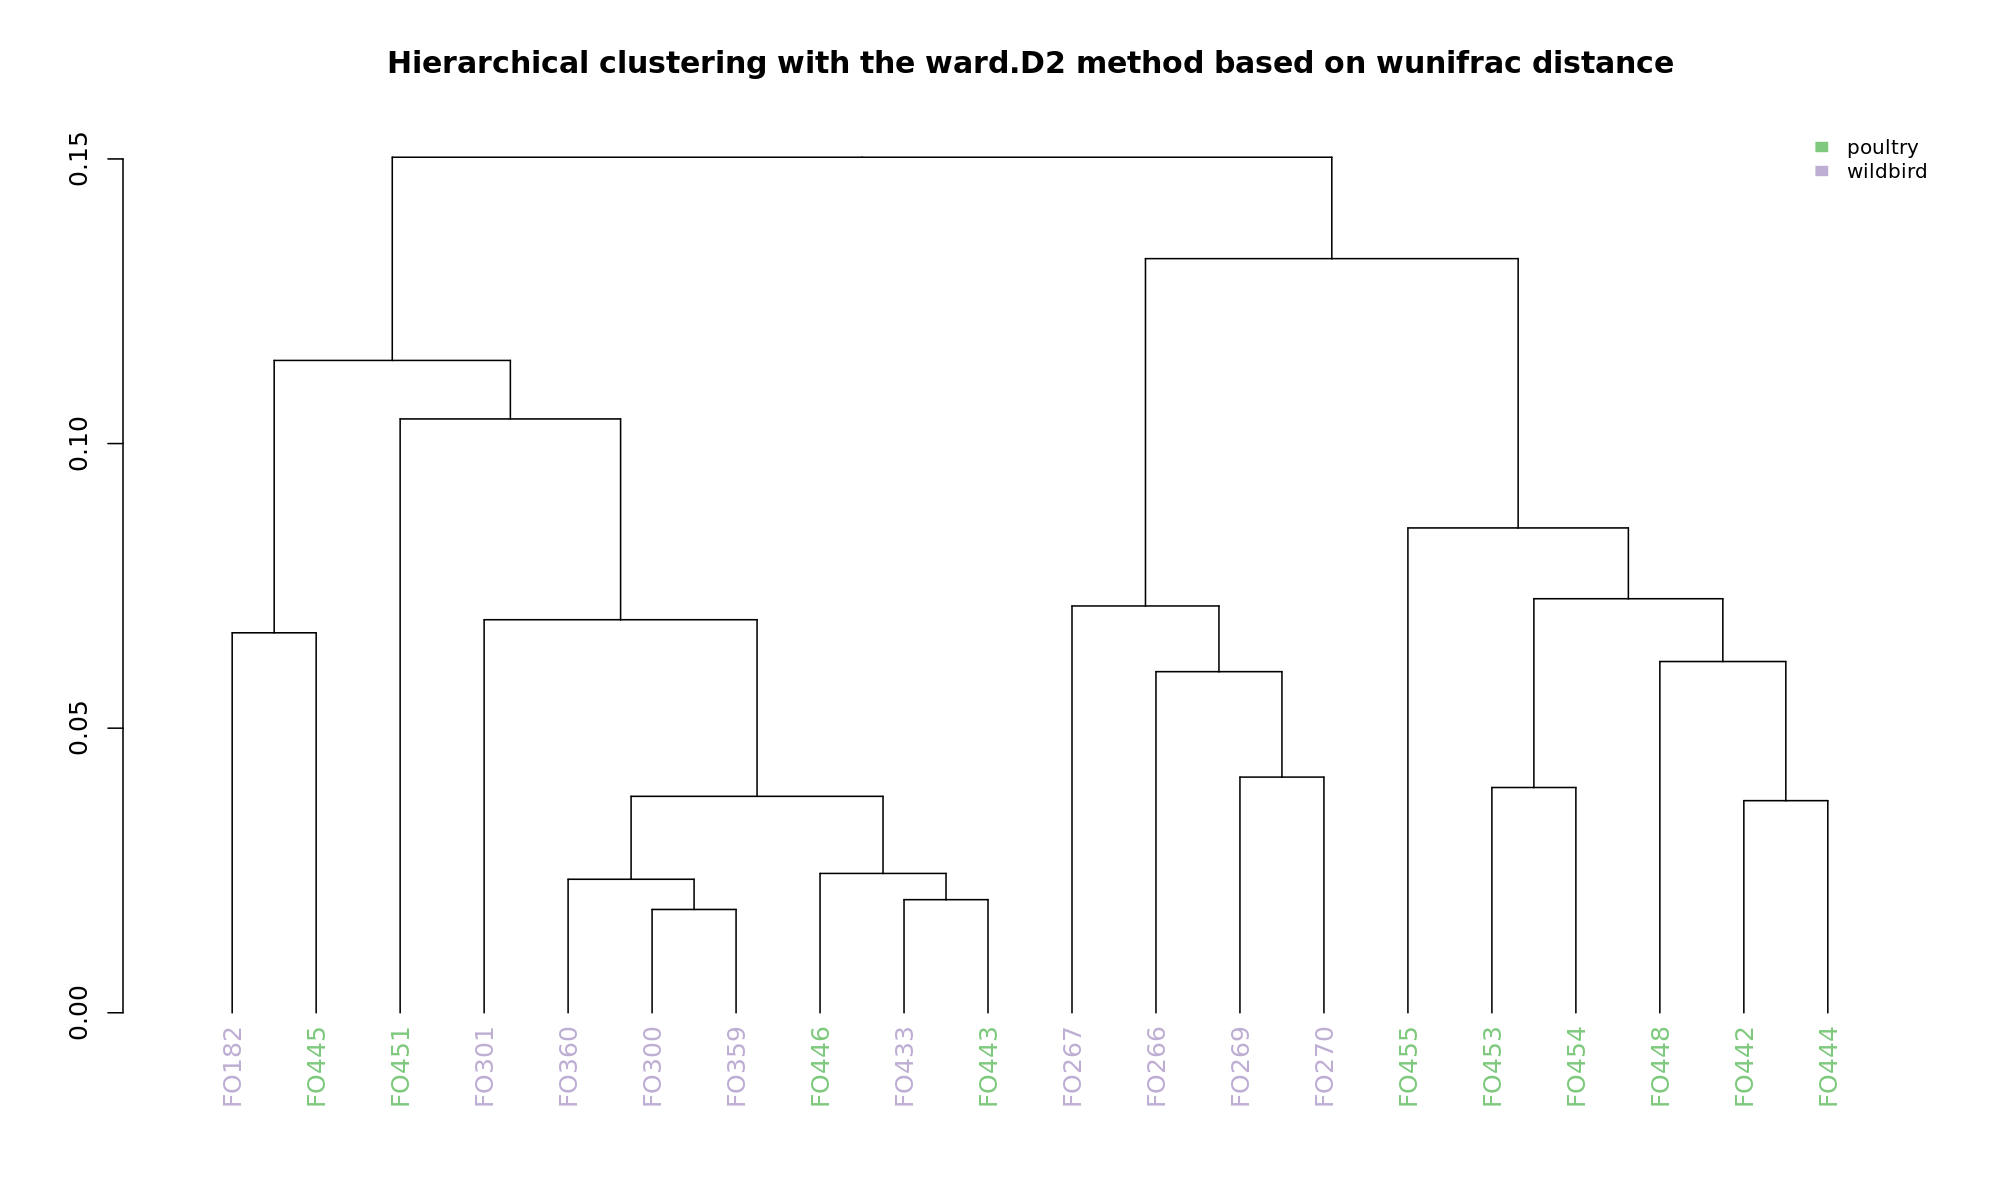
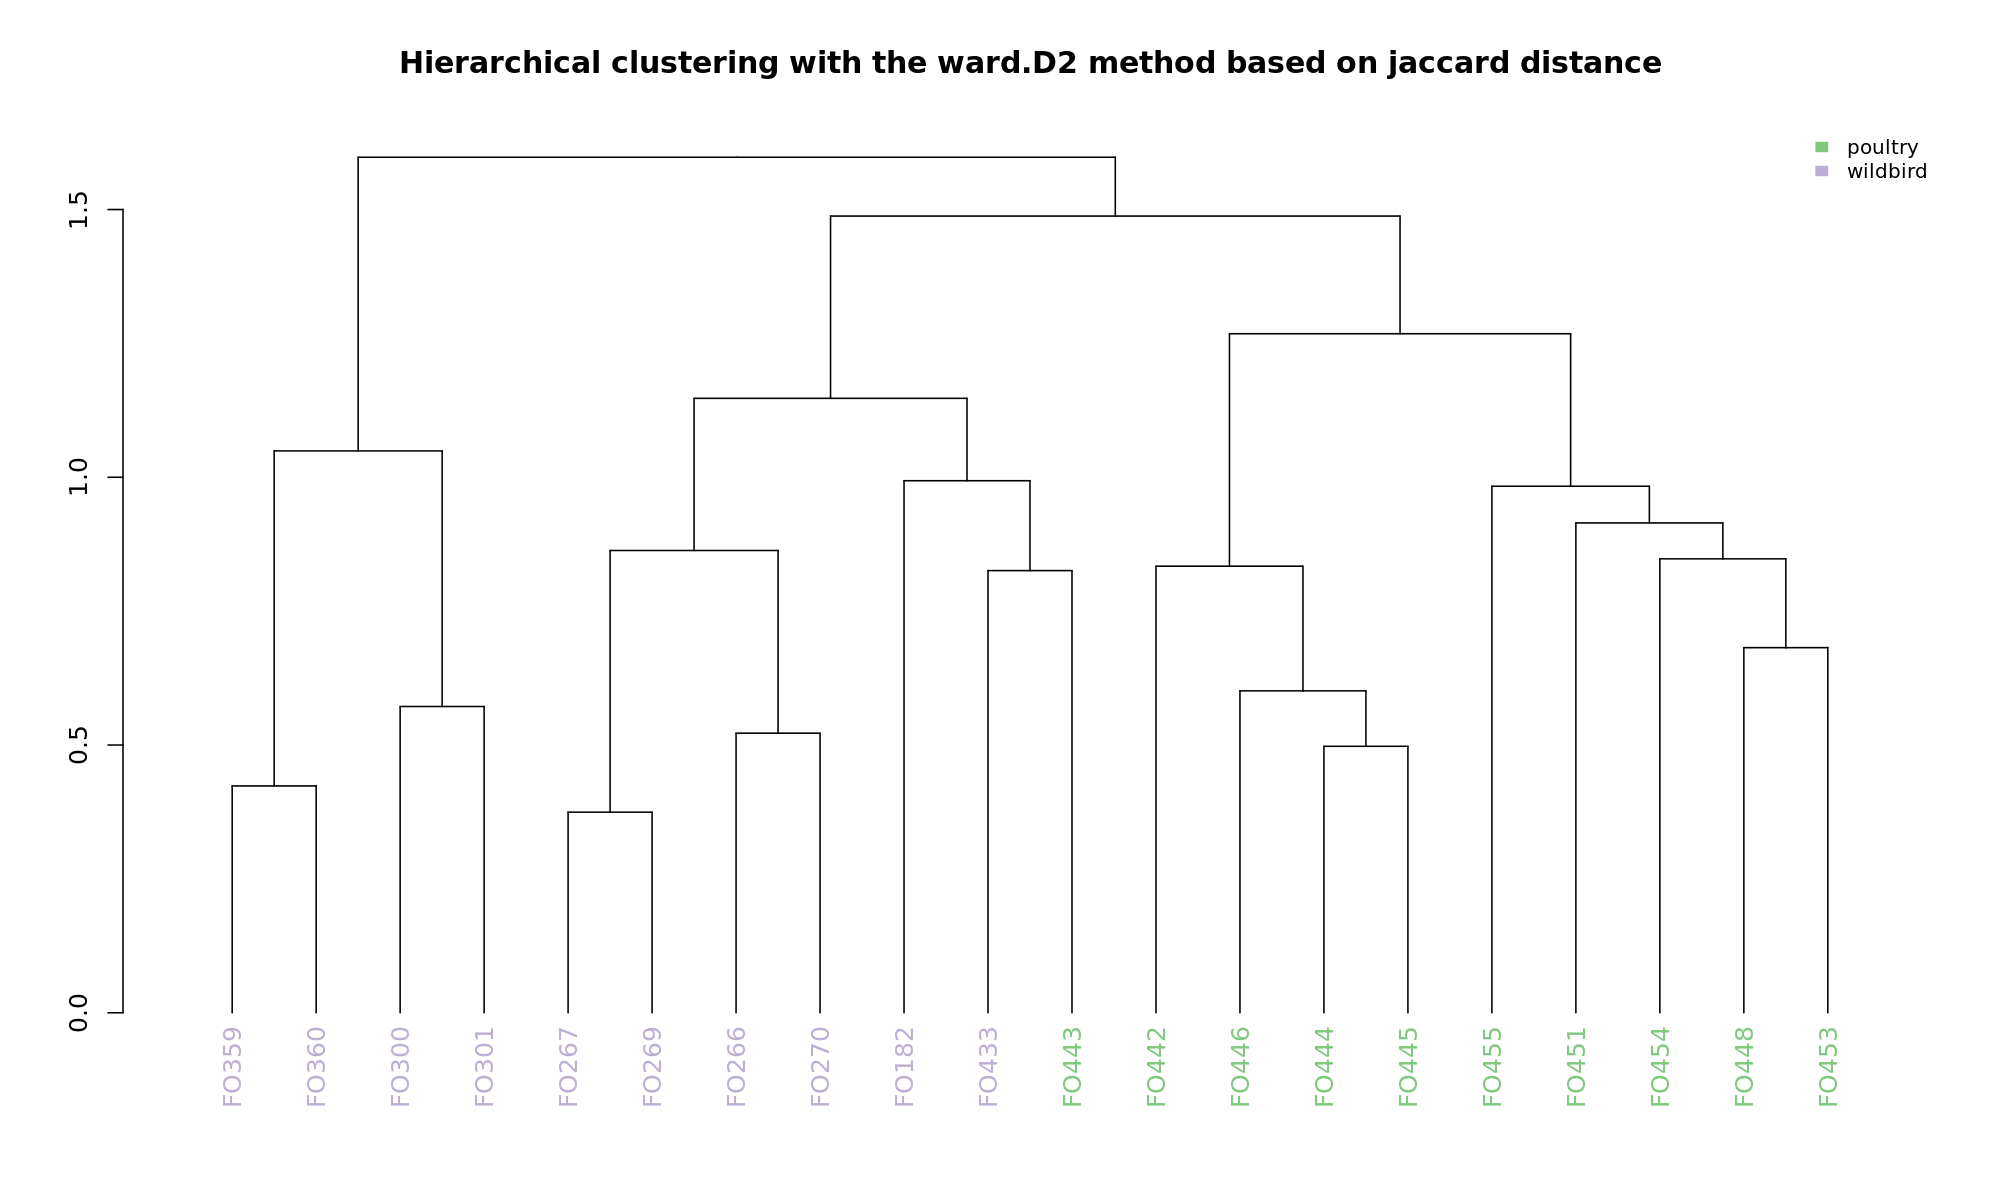
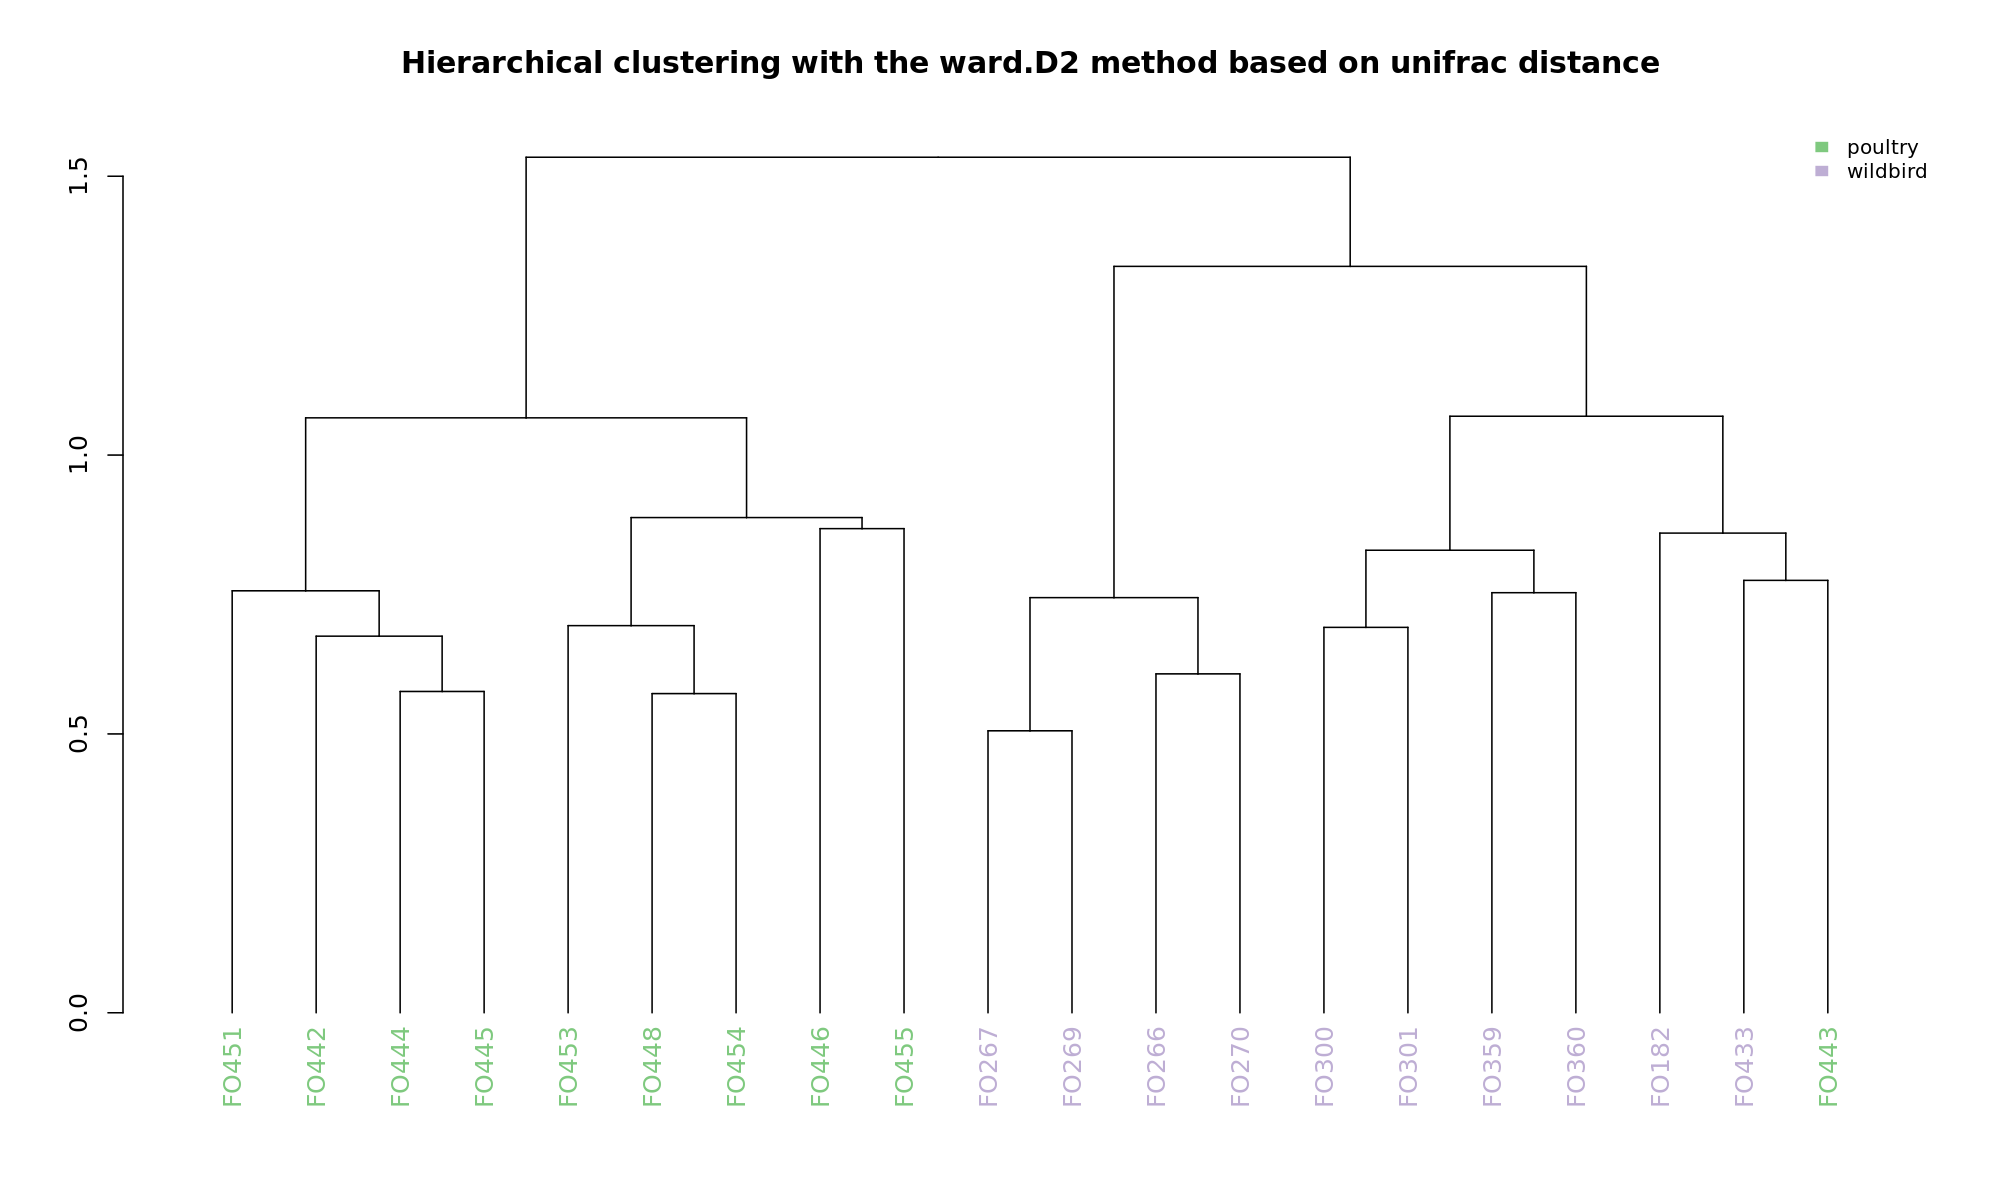
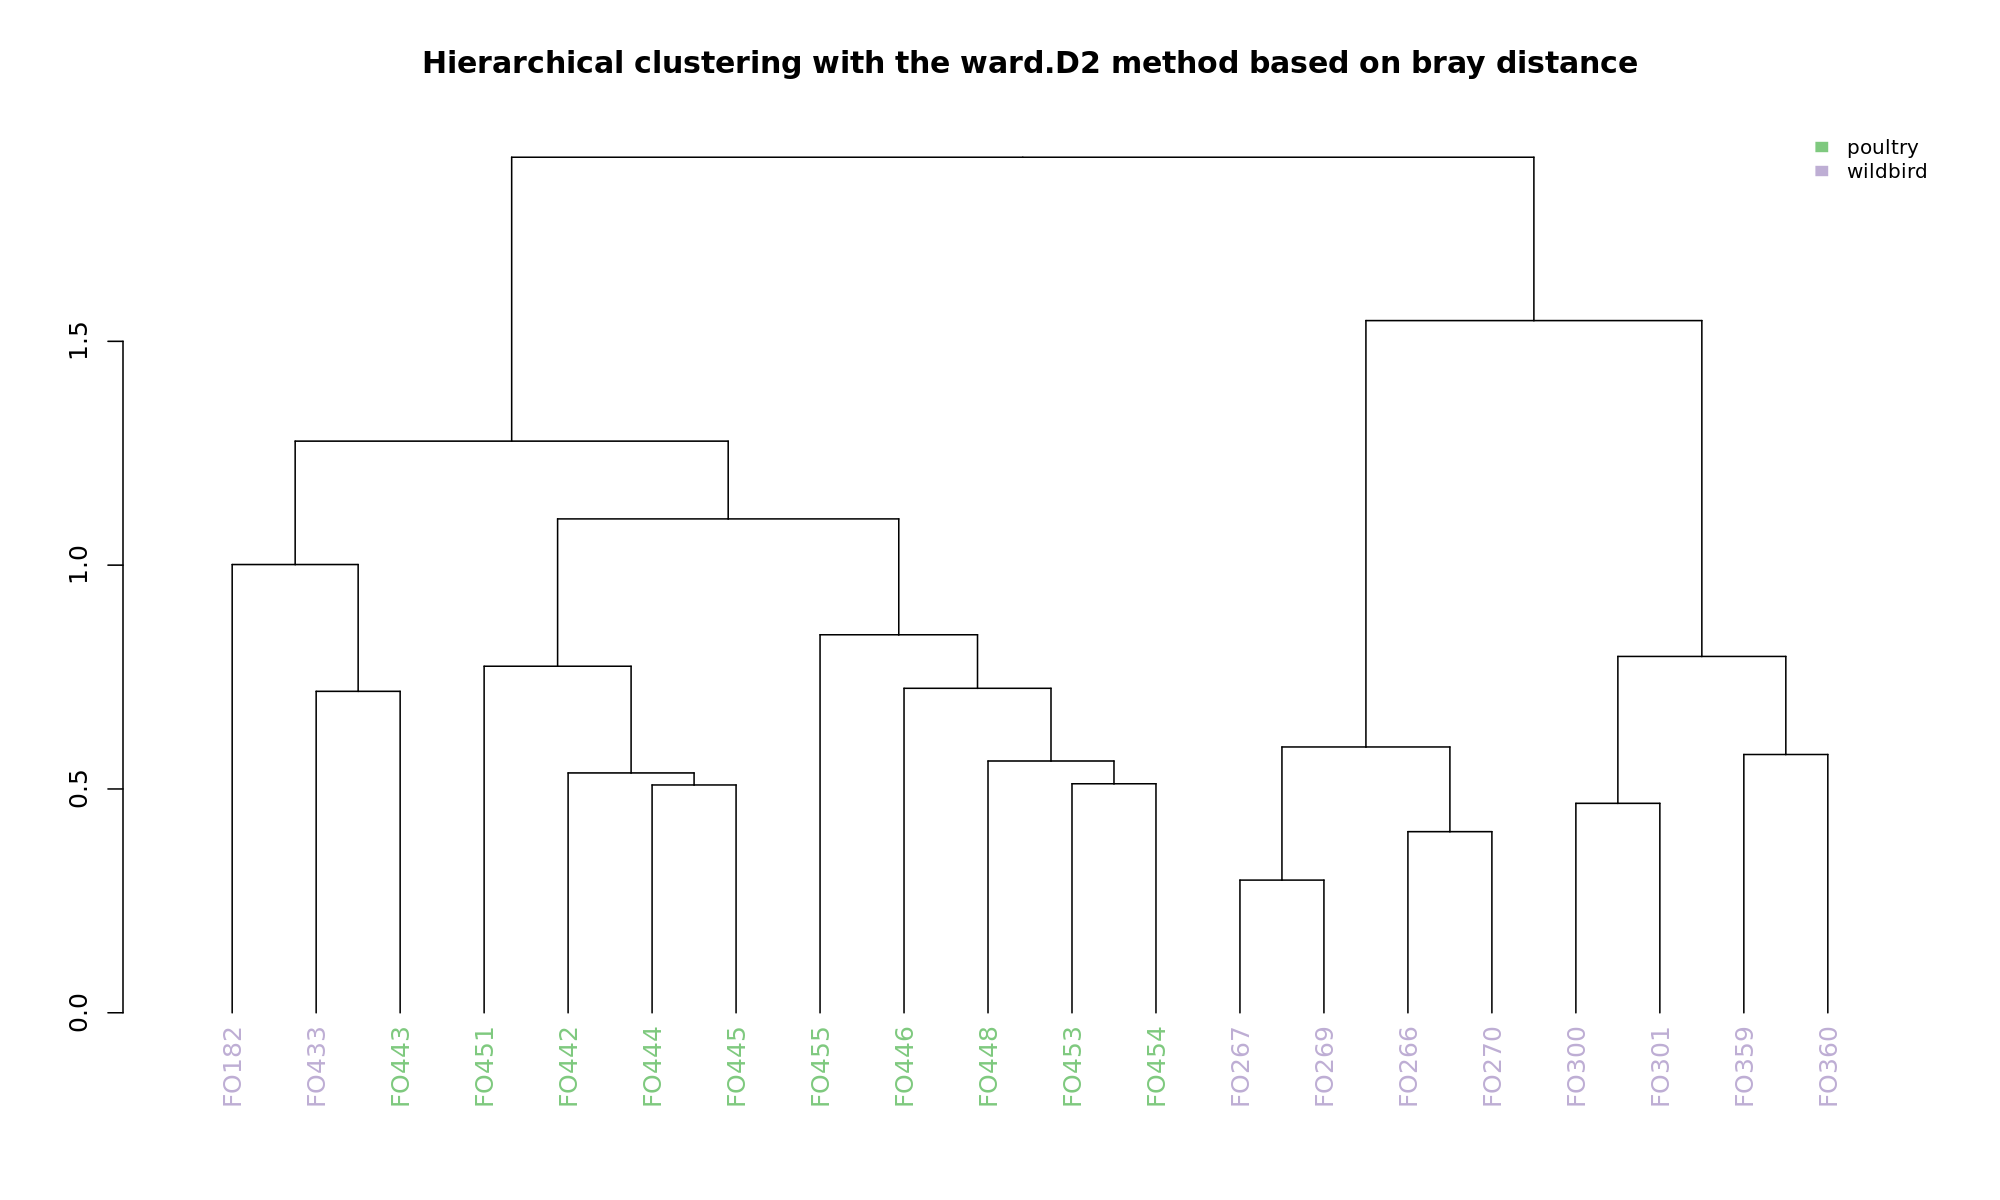
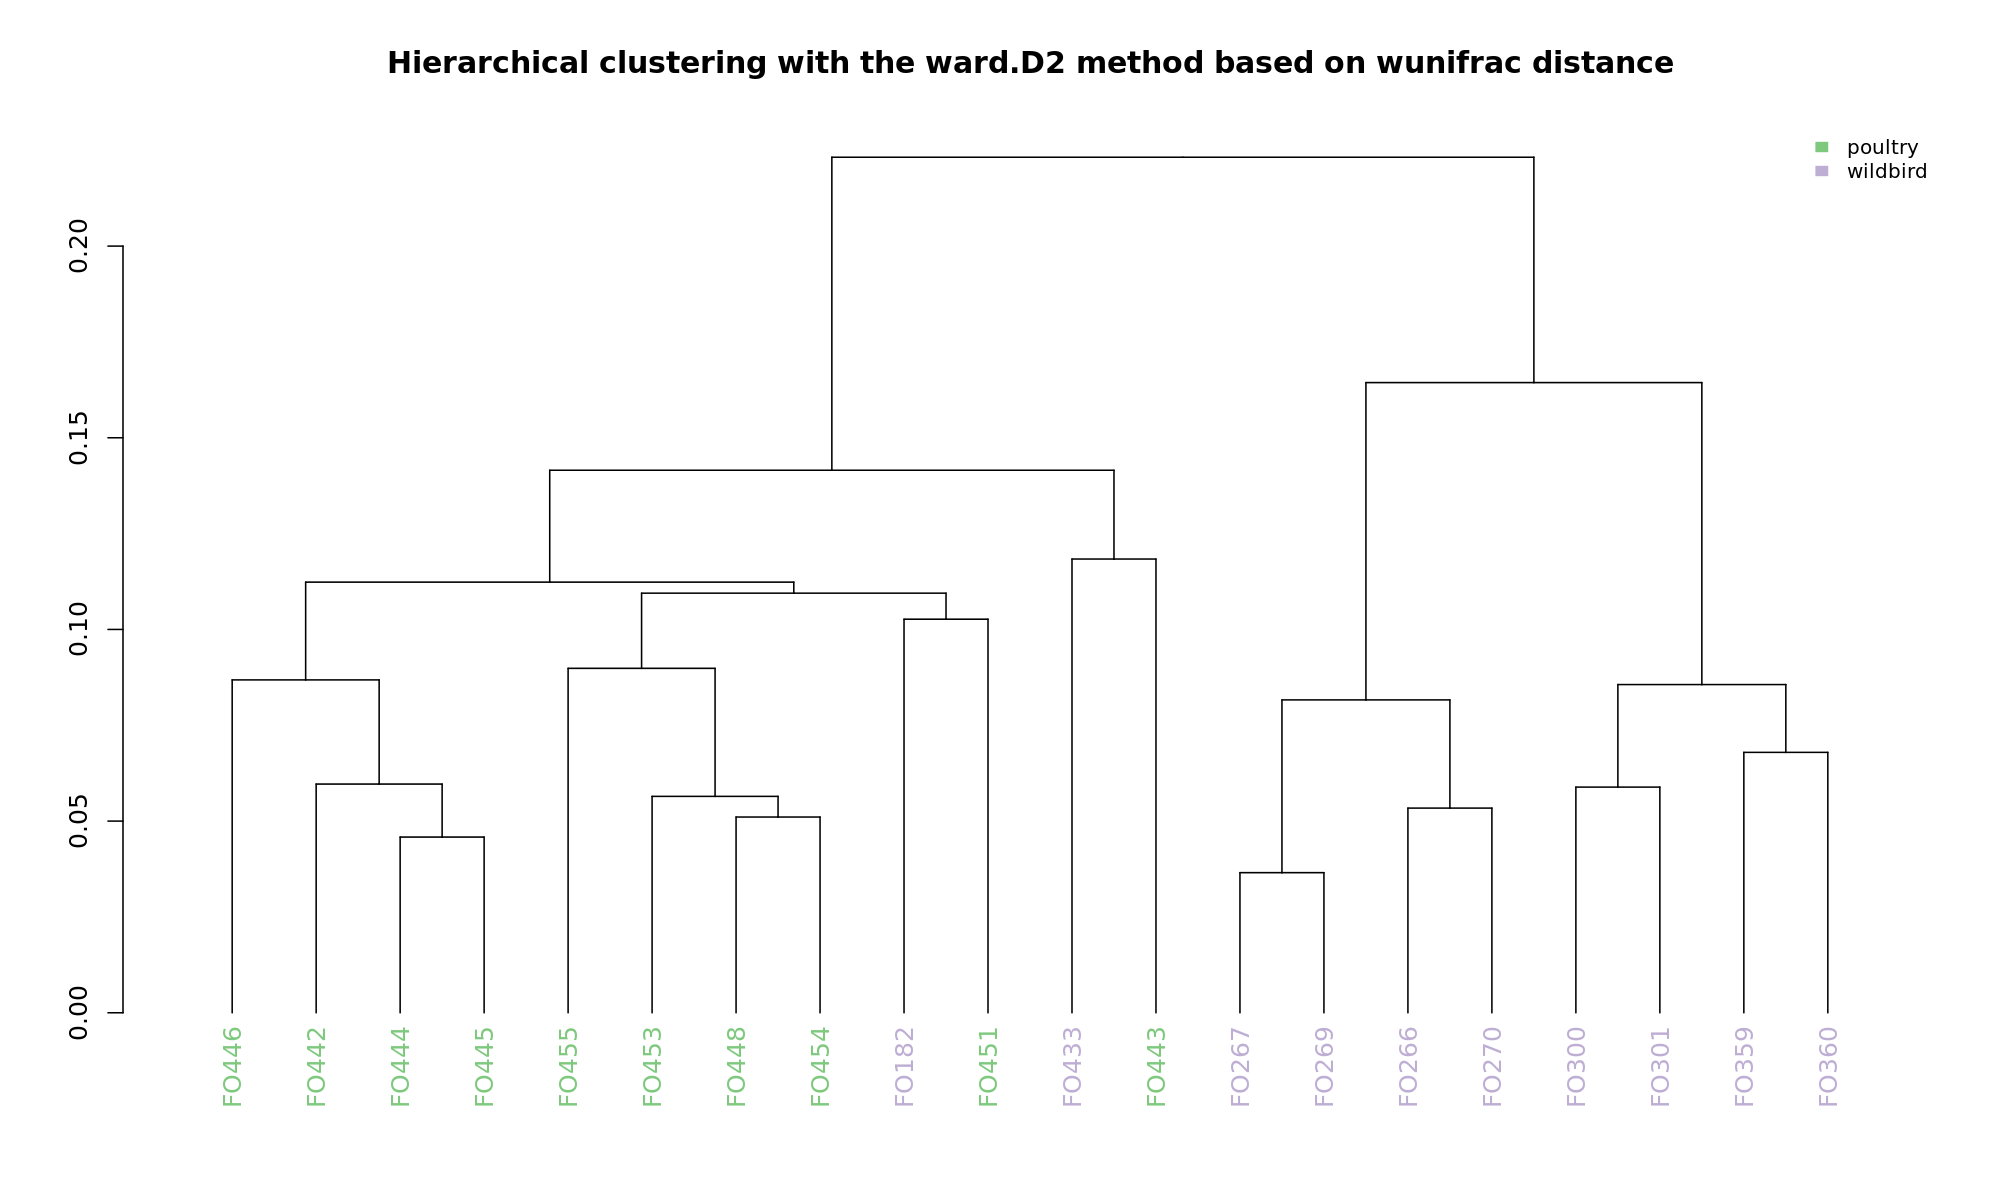
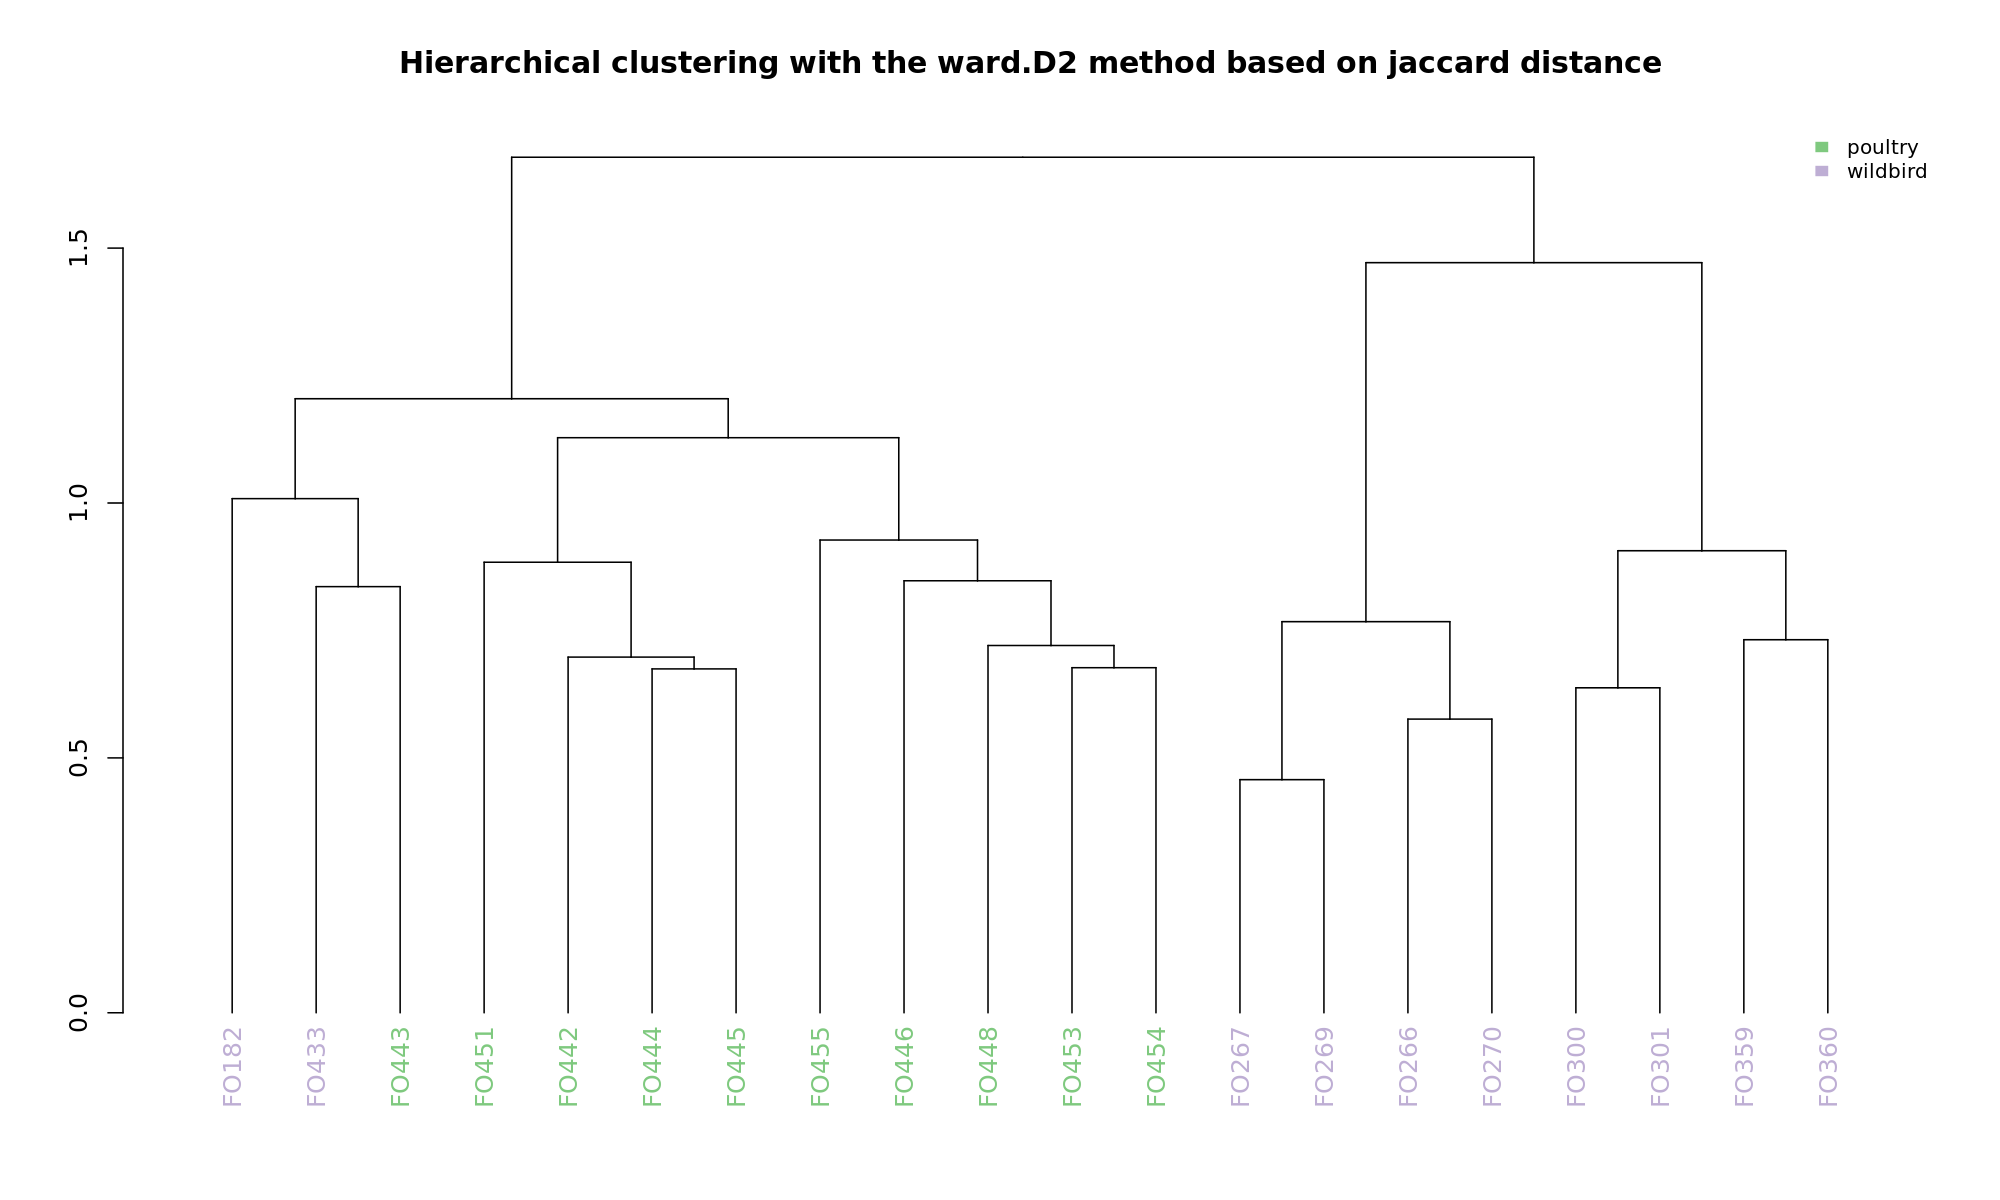
Ordination and hierarchical clustering for variable: source
NMDS
PCoA
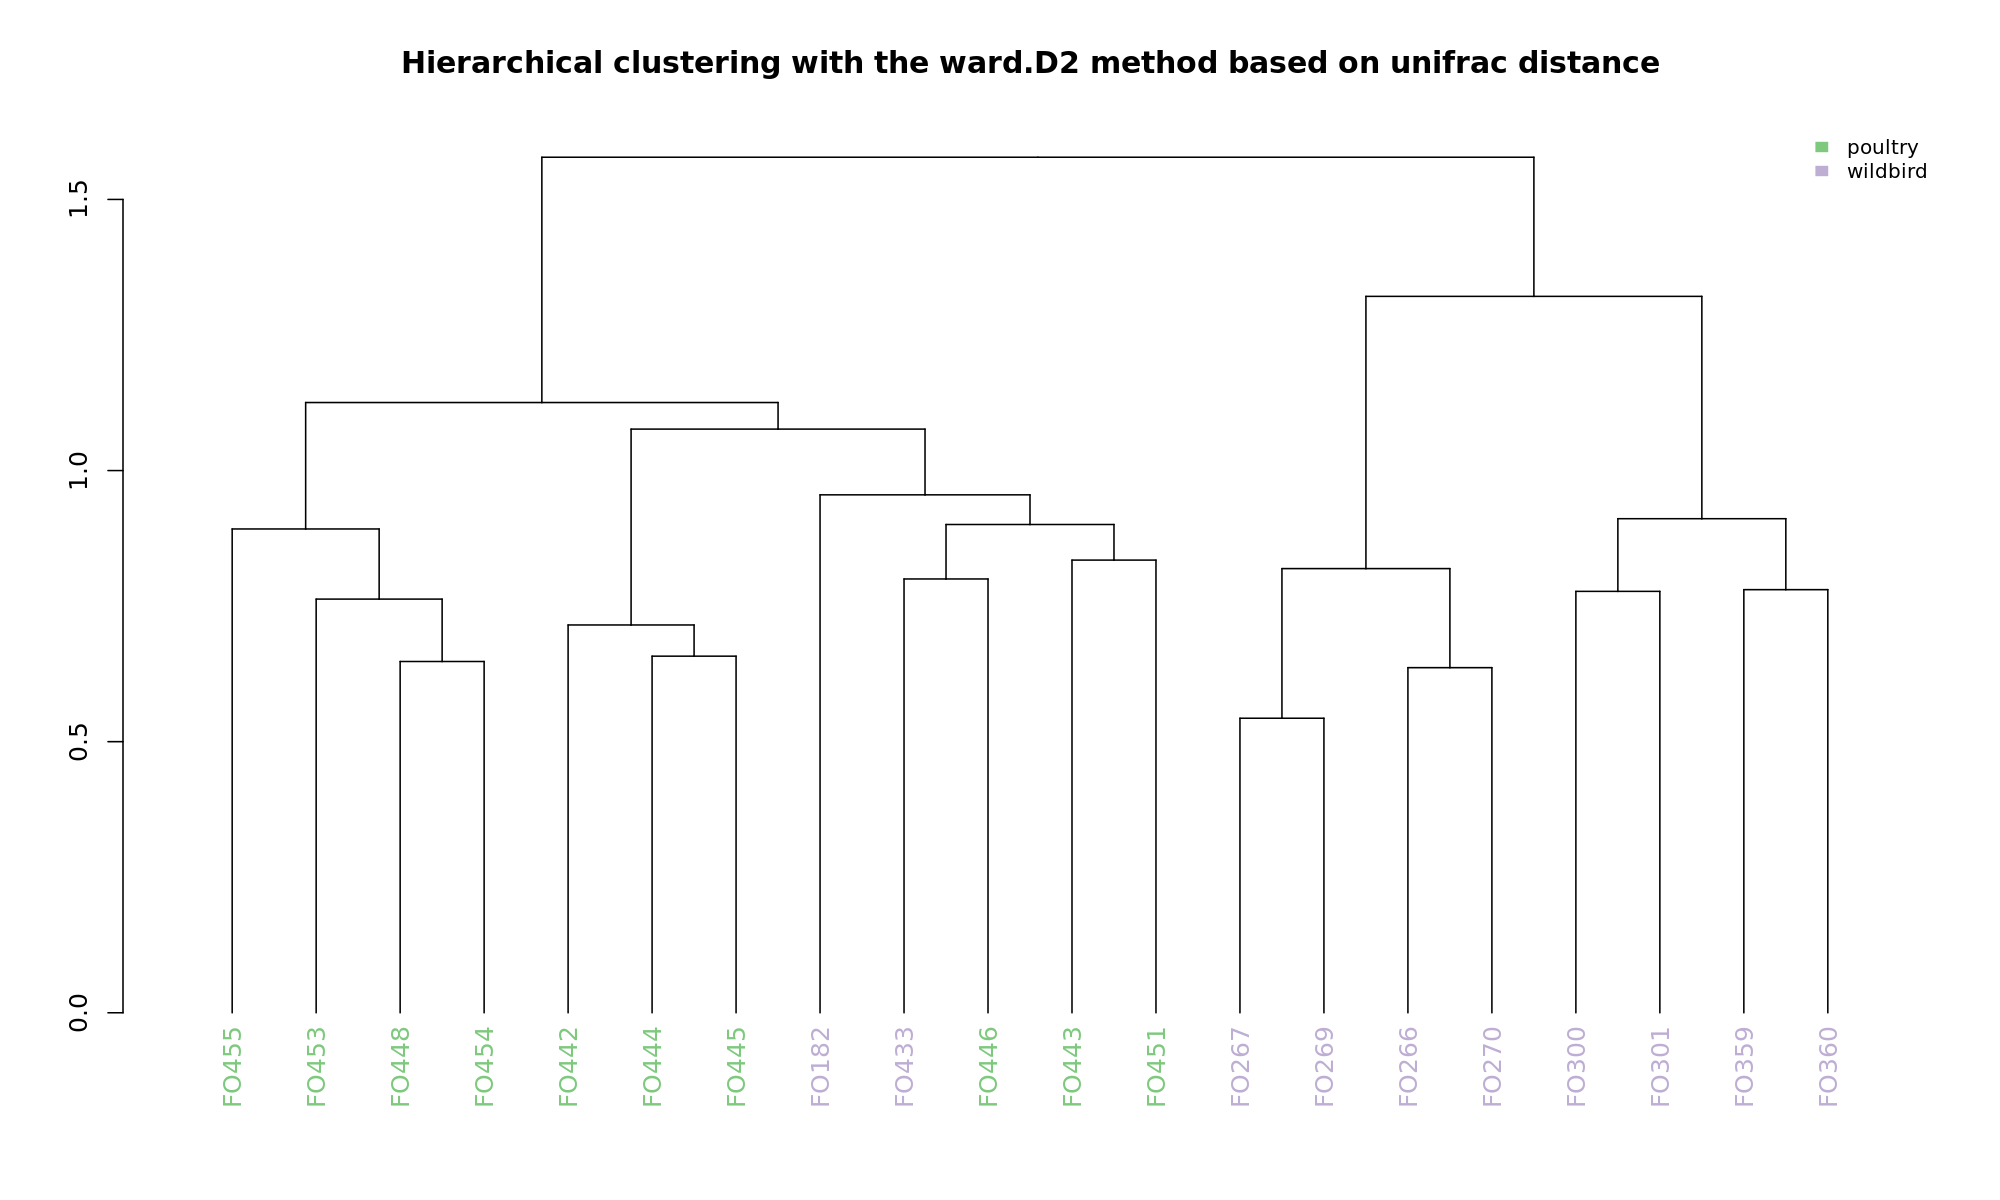
hclustering
NMDS
PCoA
hclustering
NMDS
PCoA
hclustering
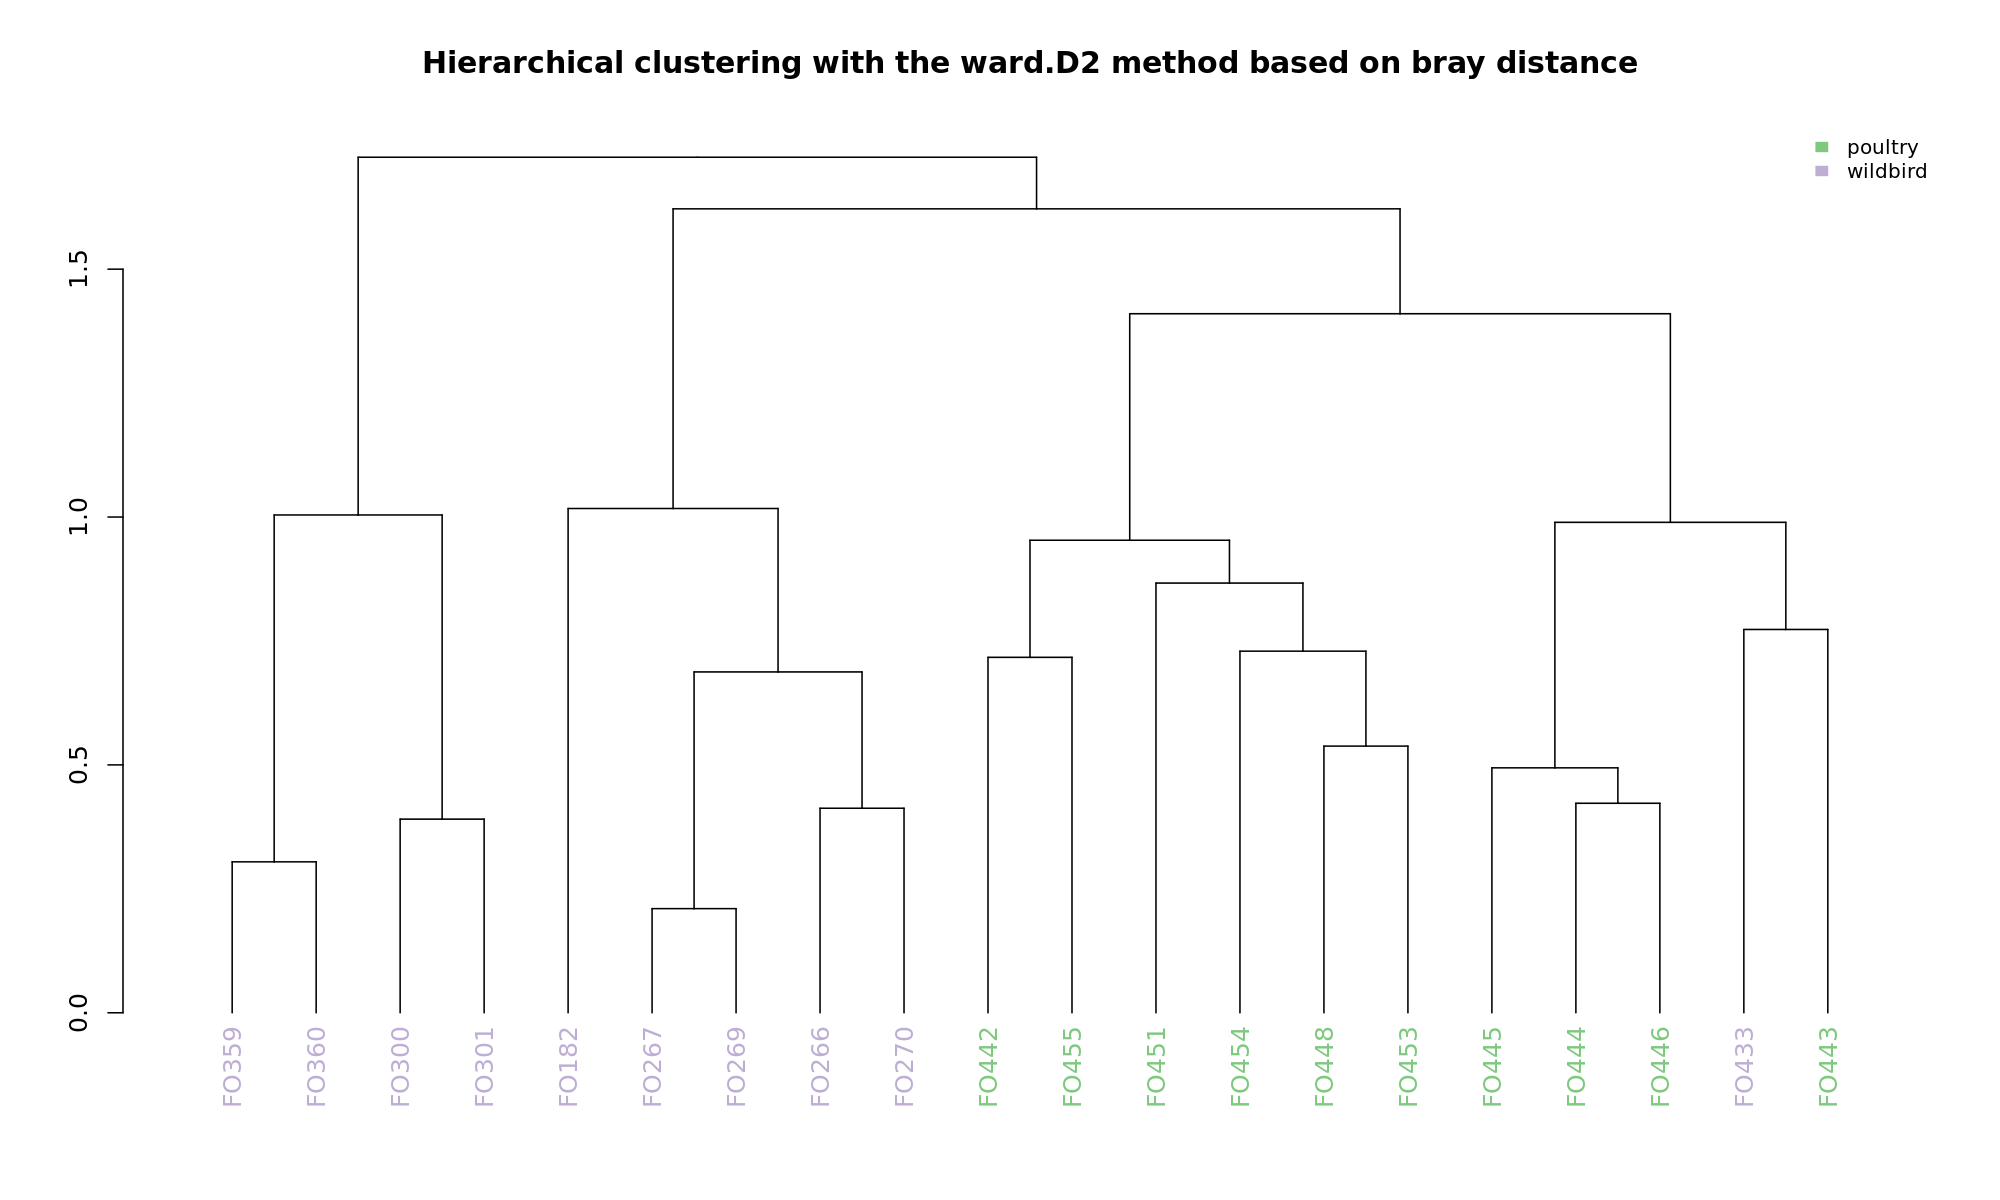
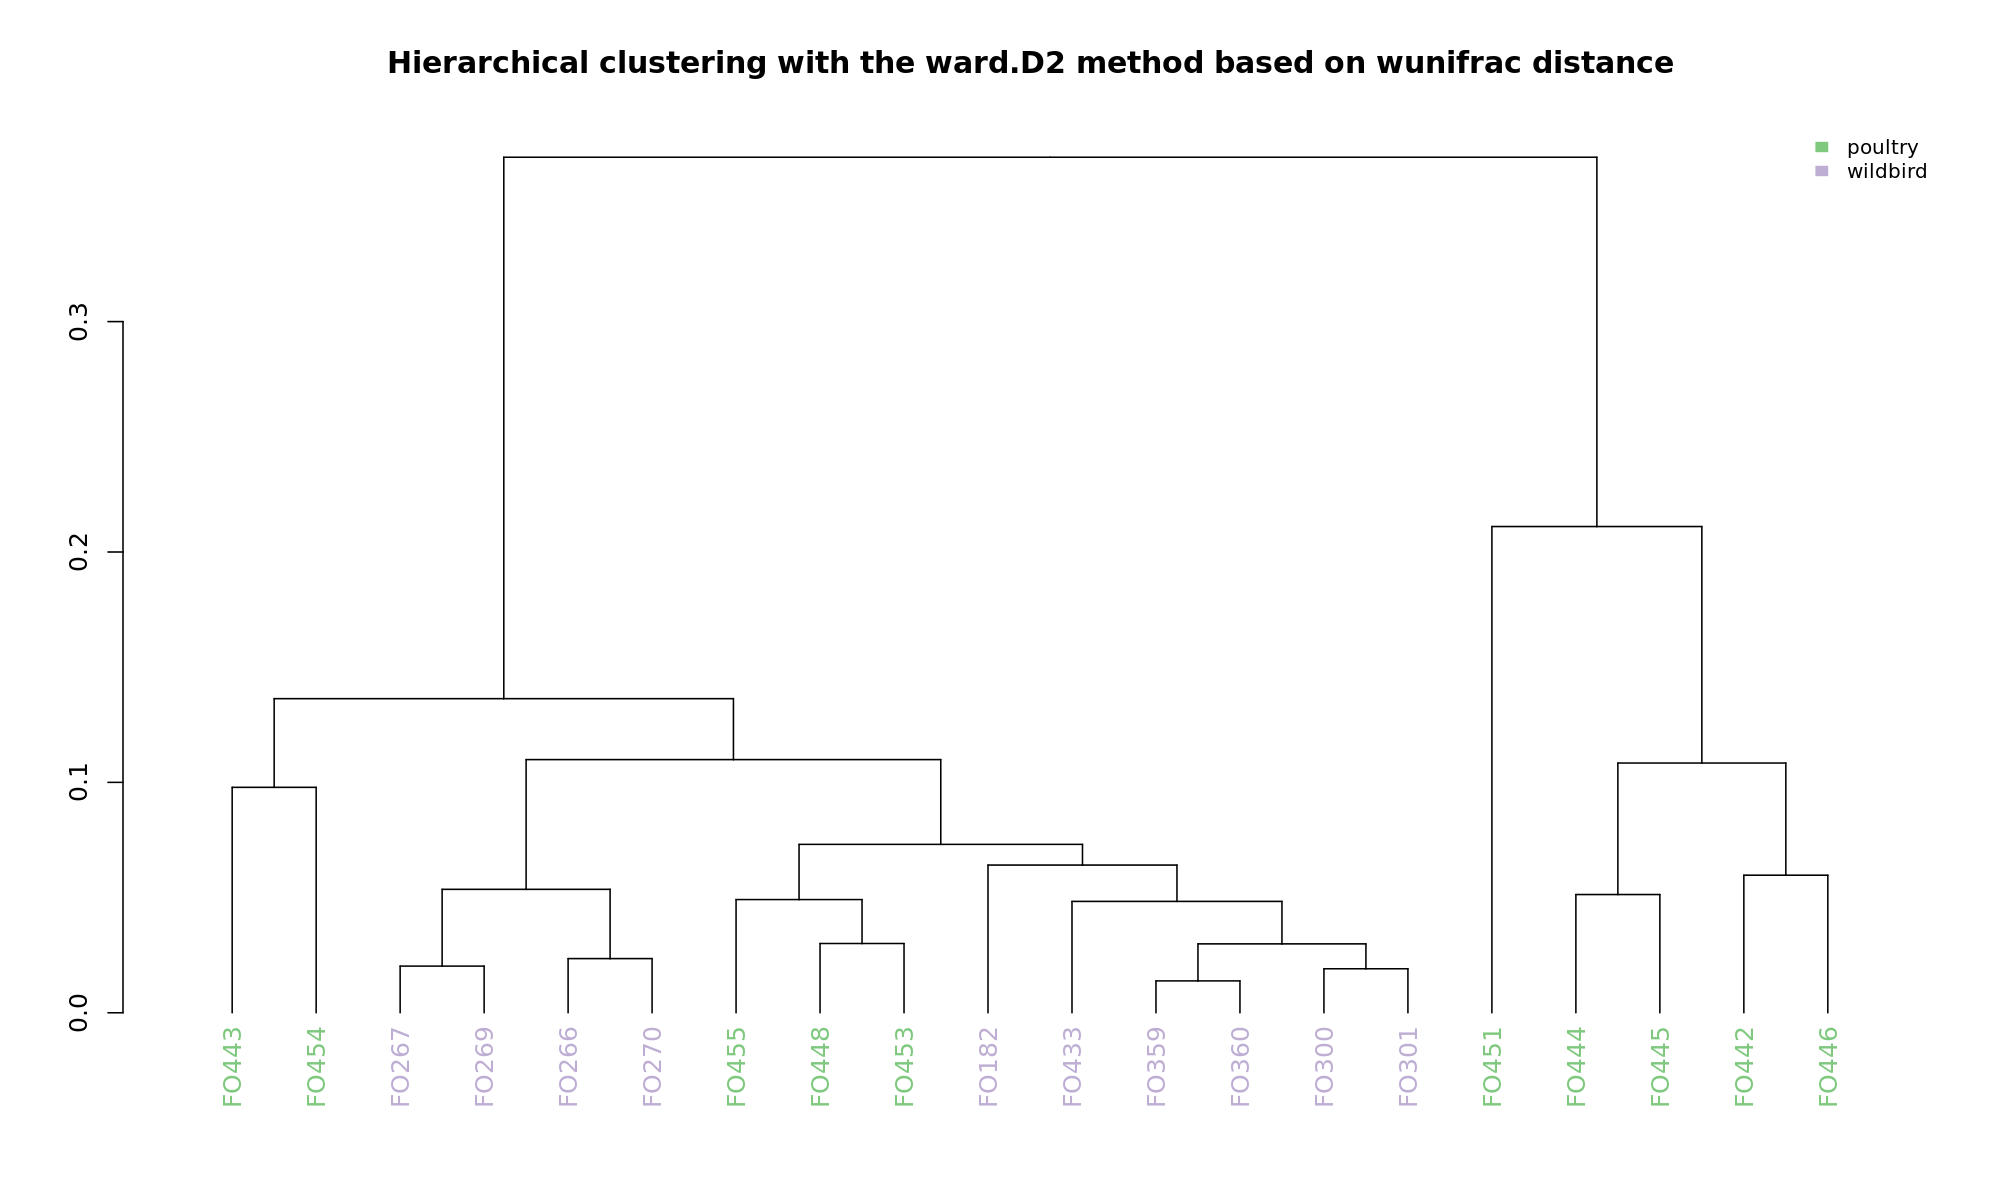

Ordination and hierarchical clustering for variable: sample_species
NMDS
PCoA
hclustering
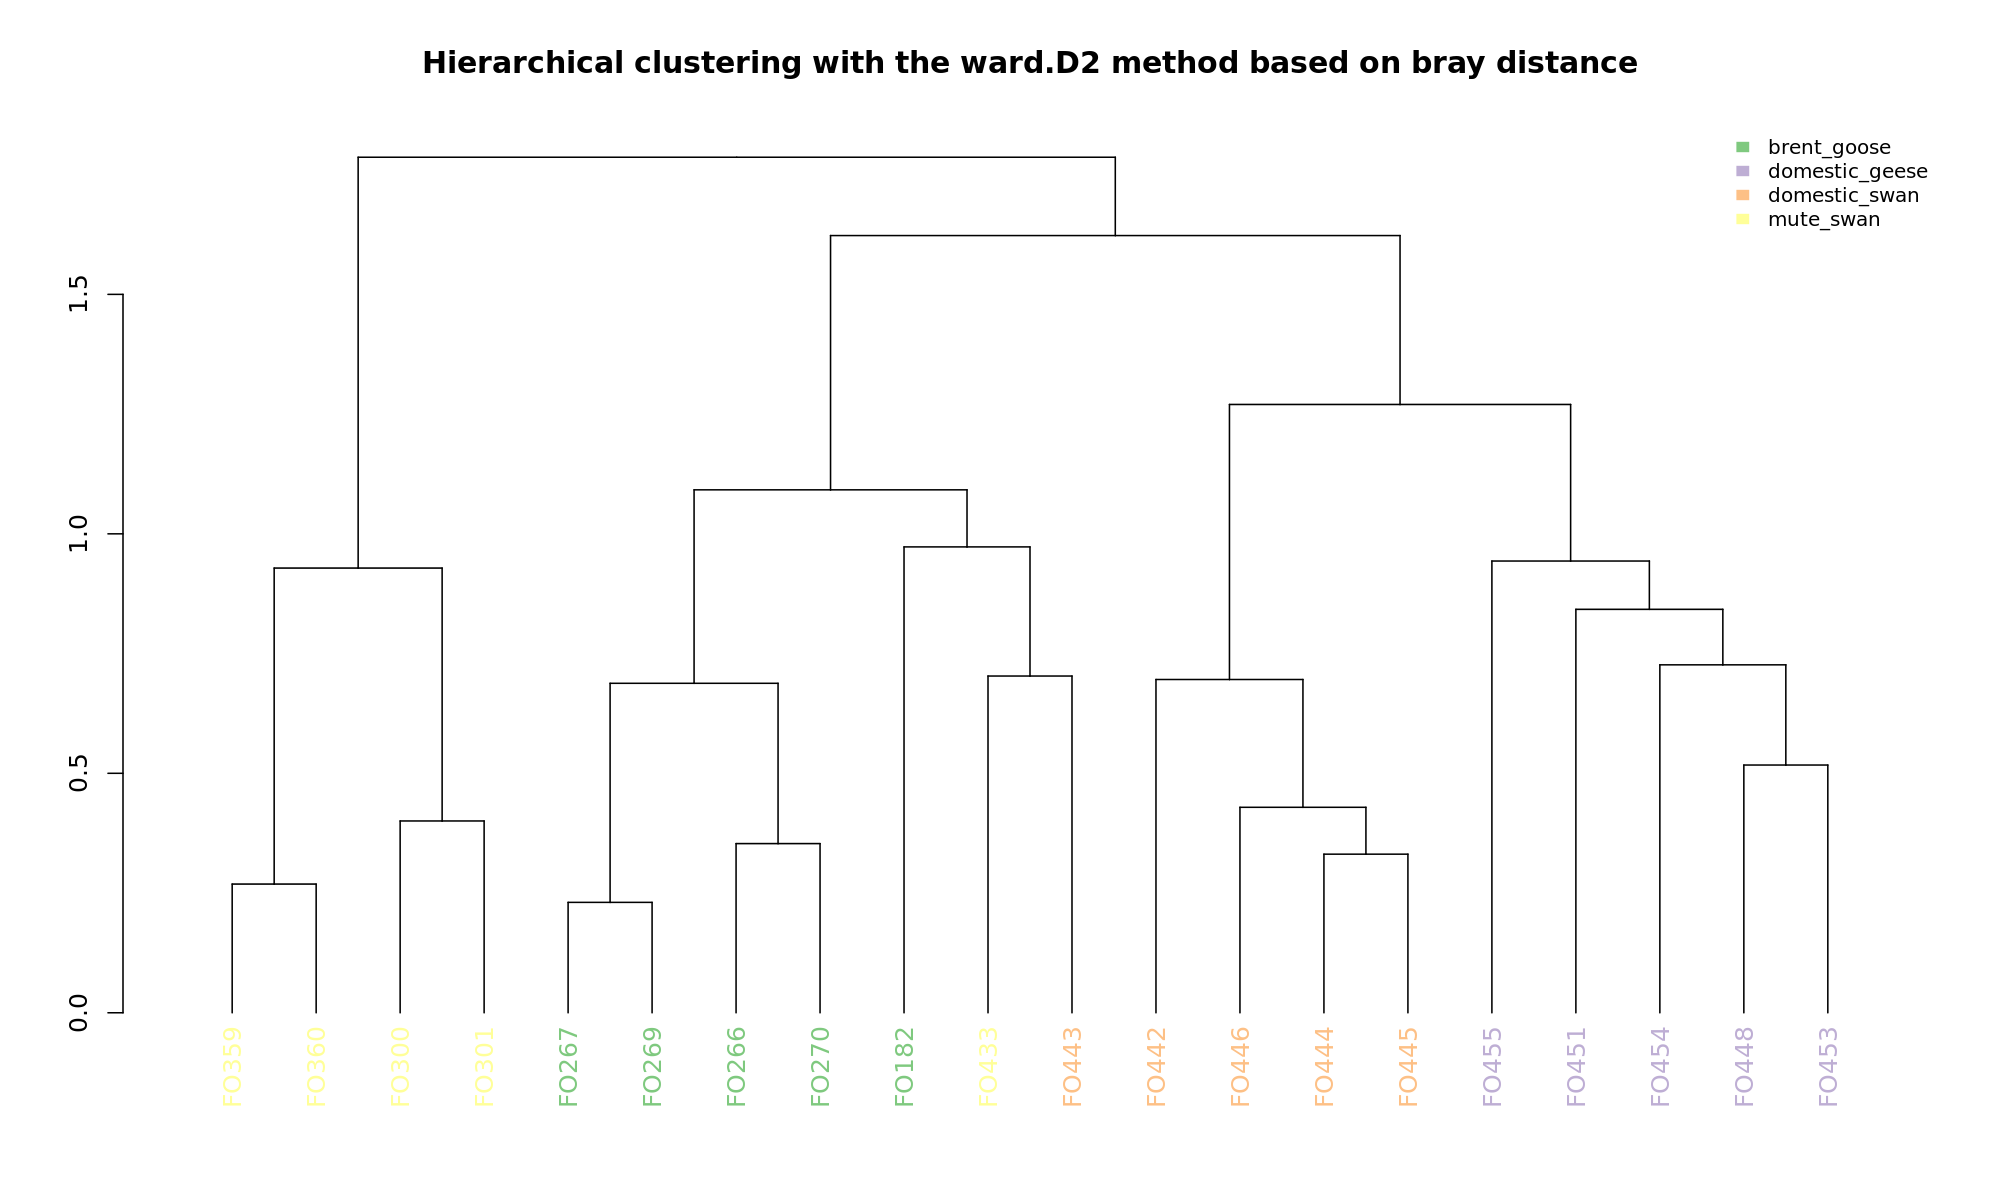
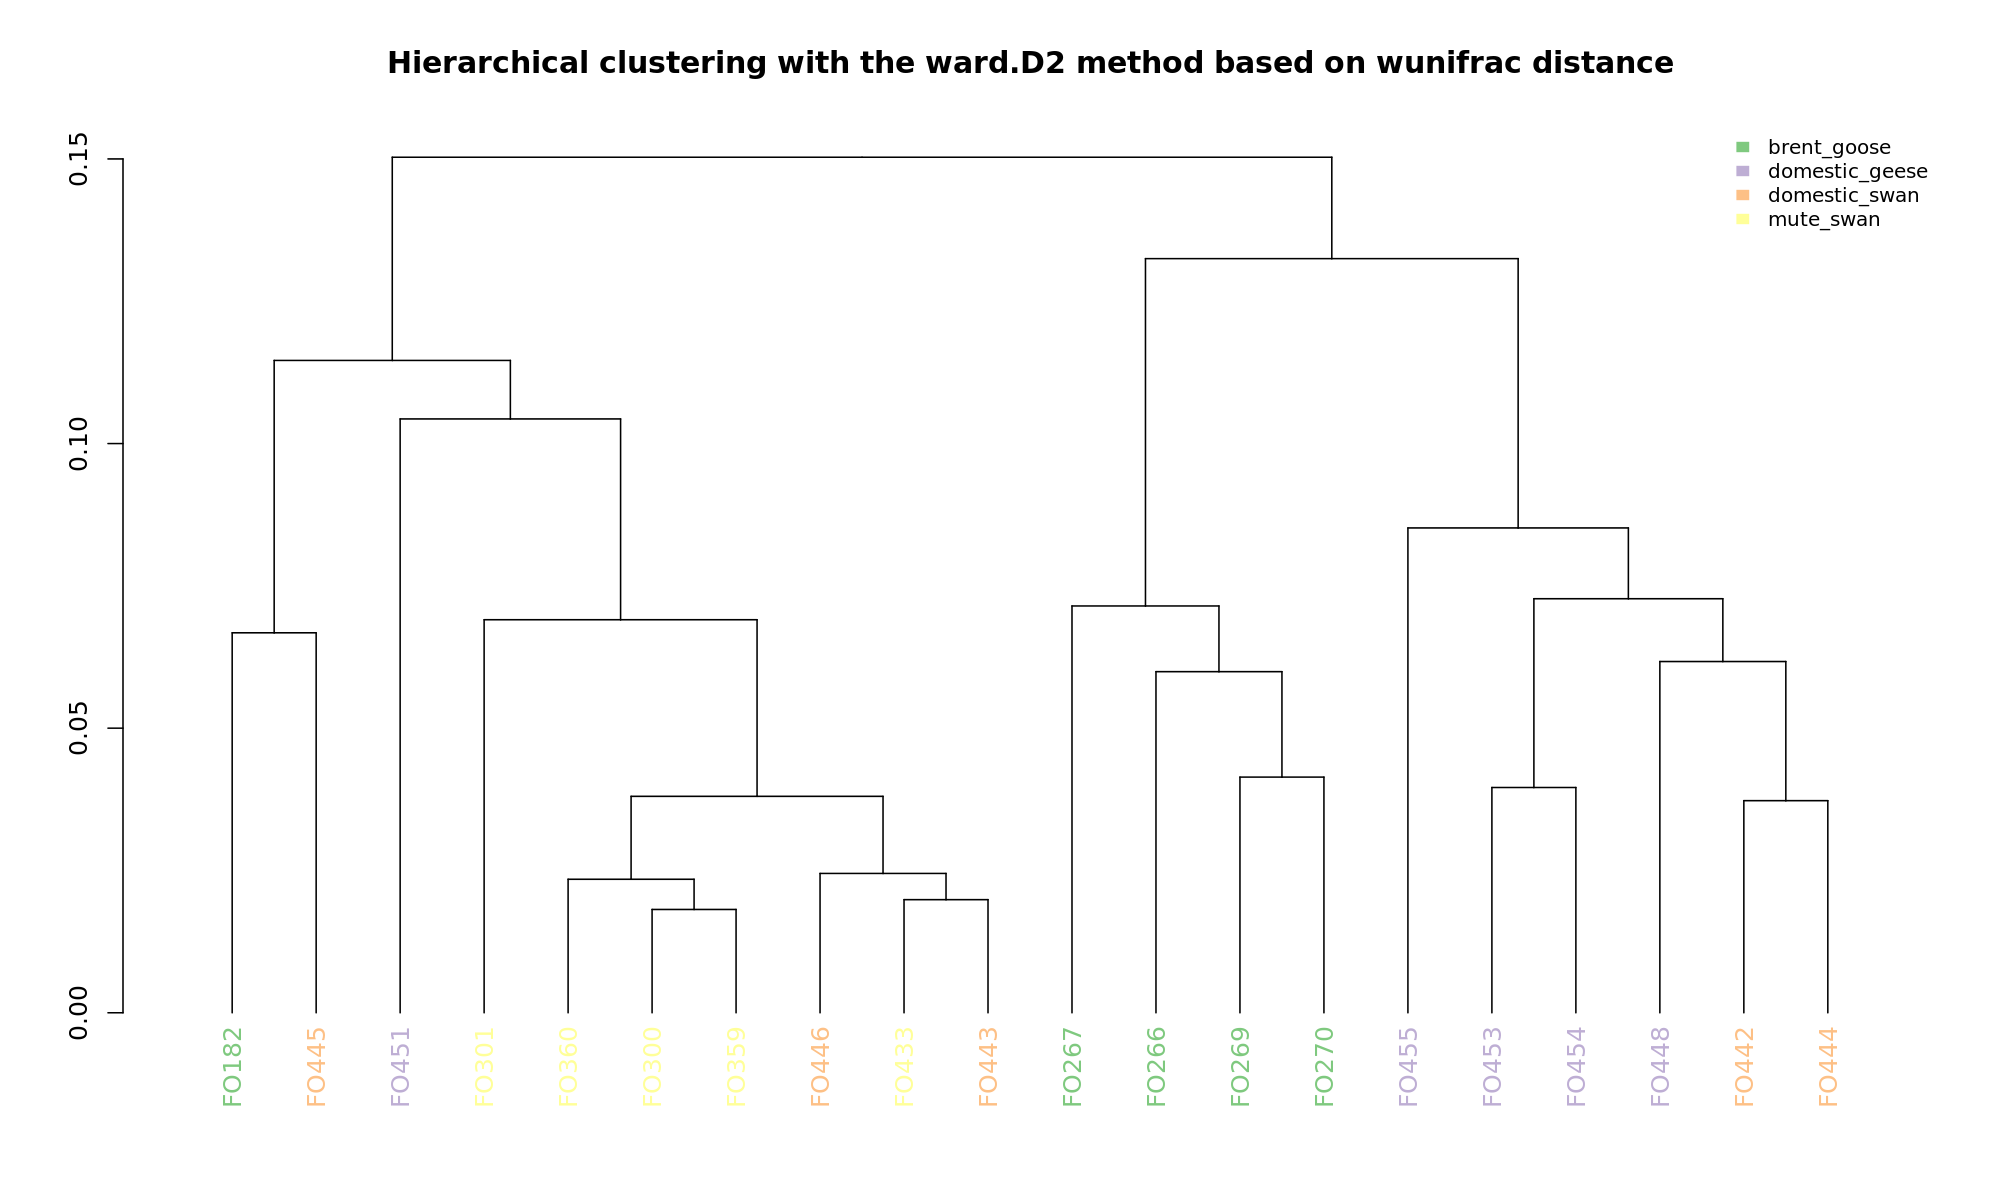
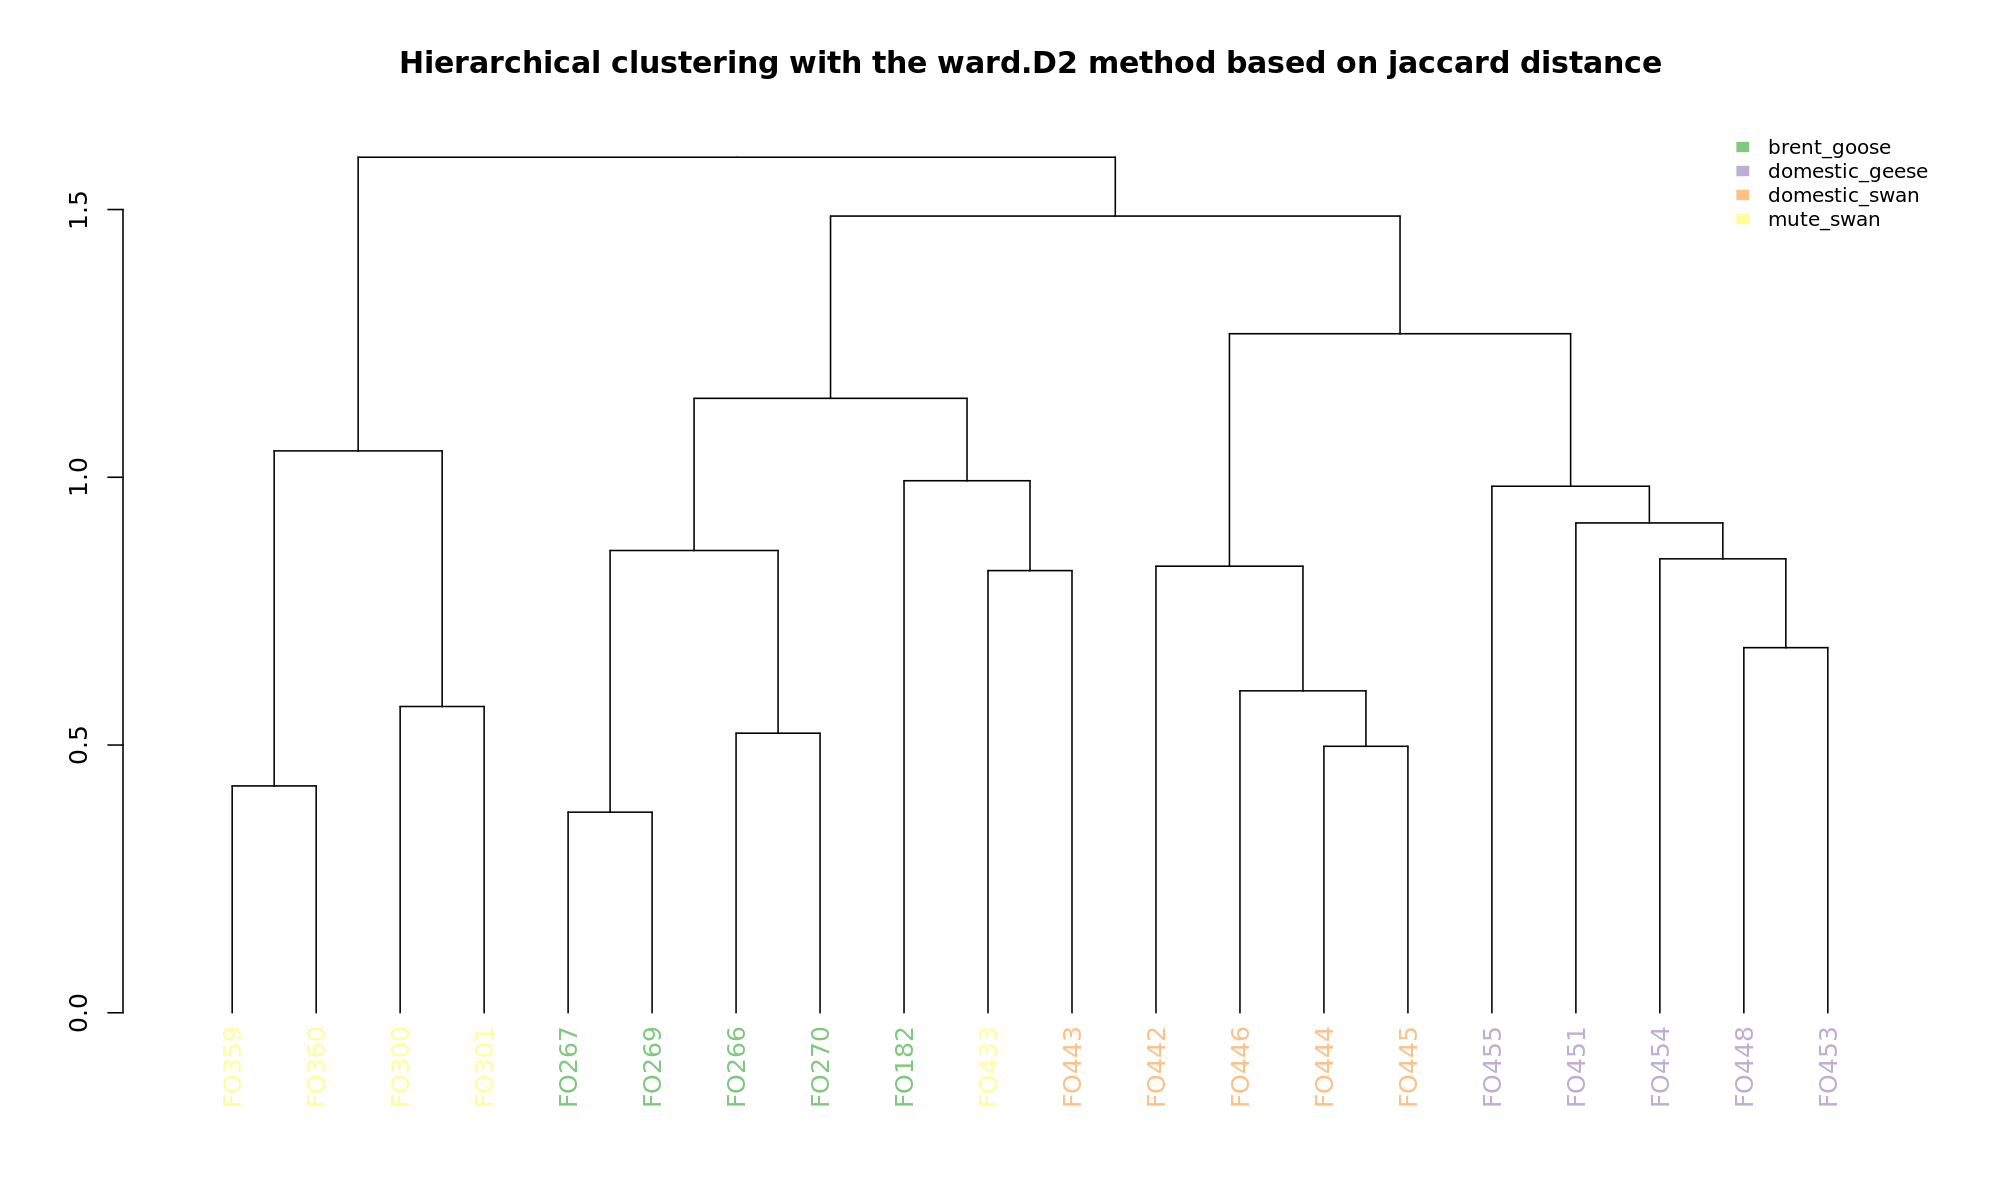
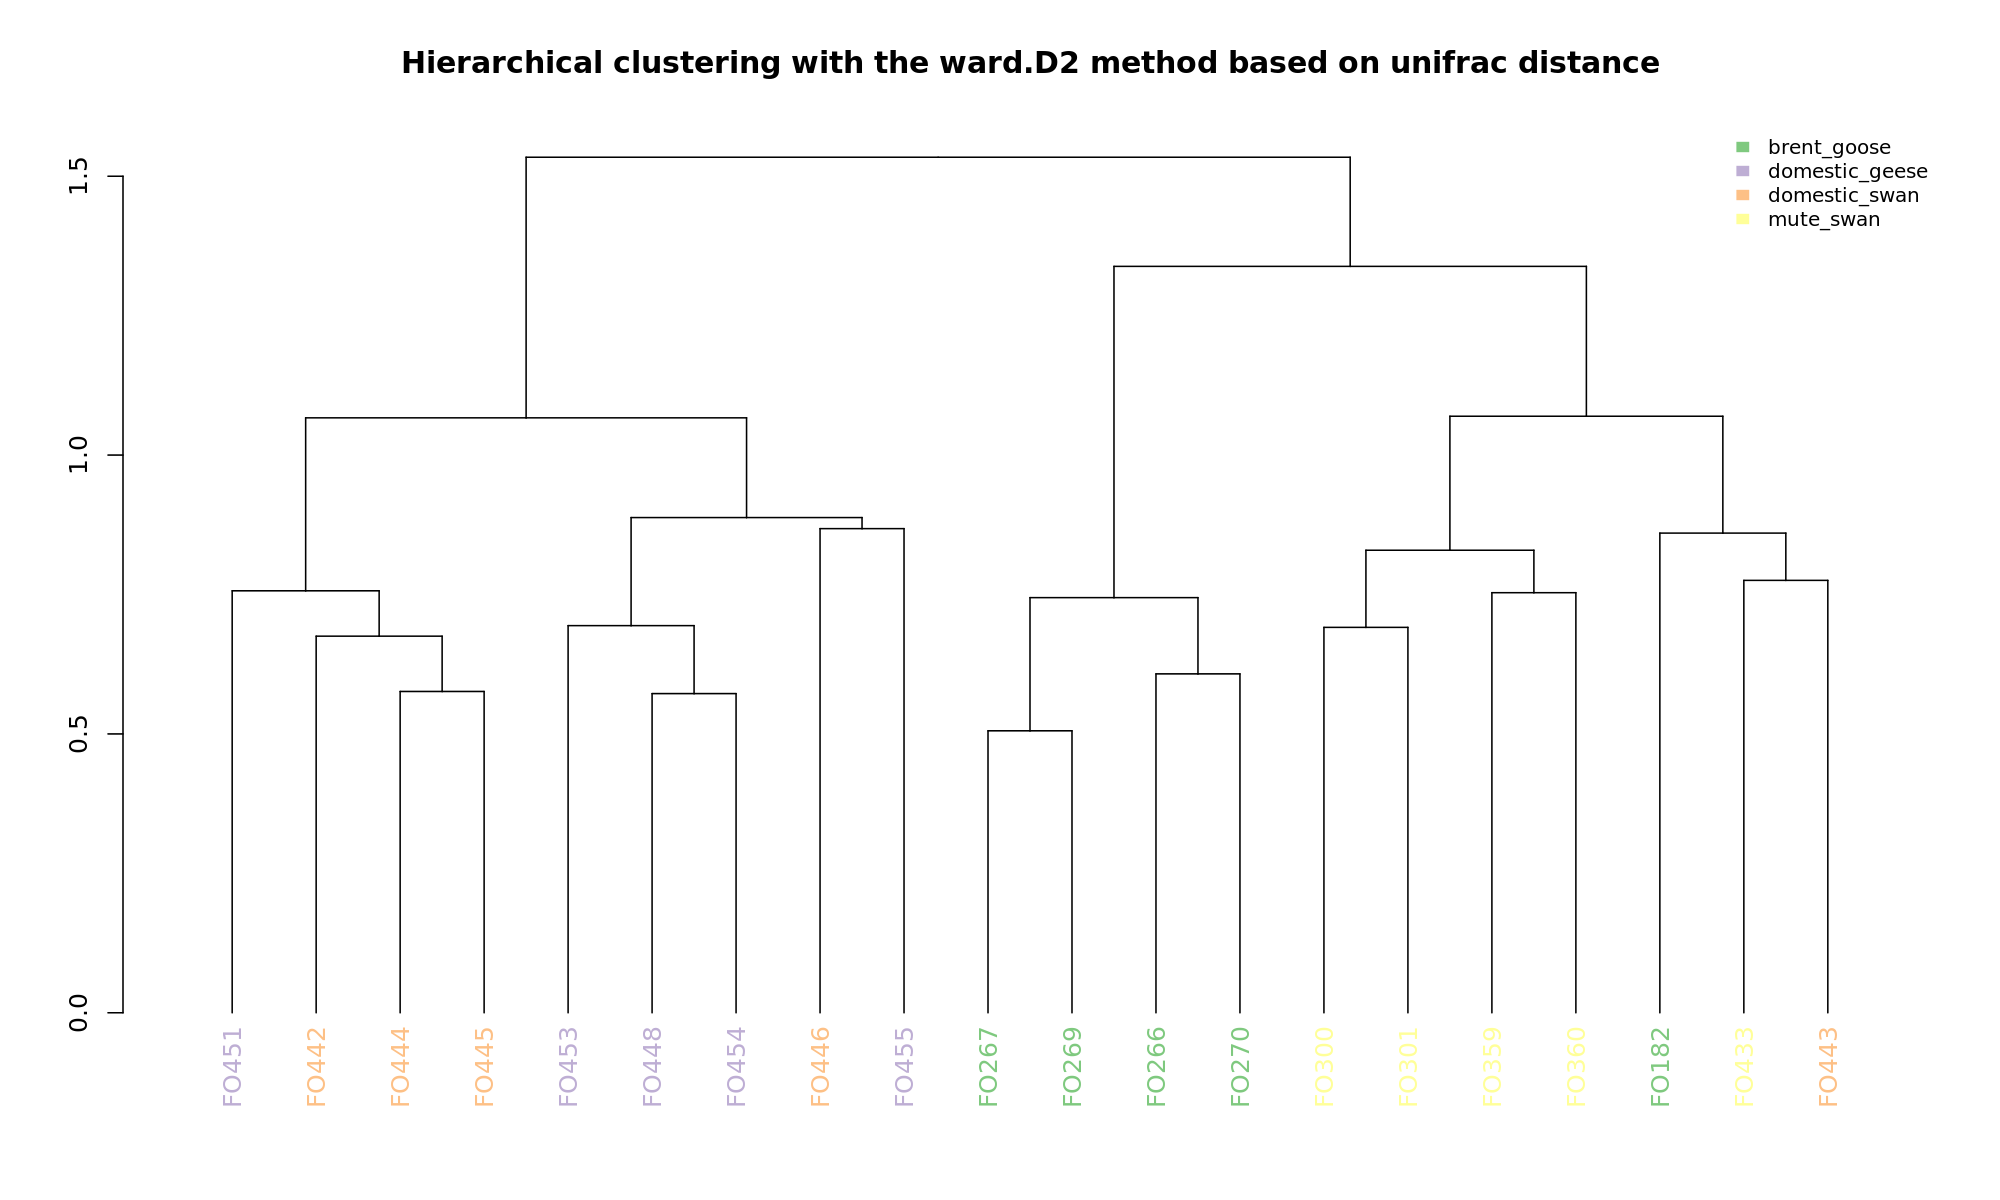
NMDS
PCoA
hclustering
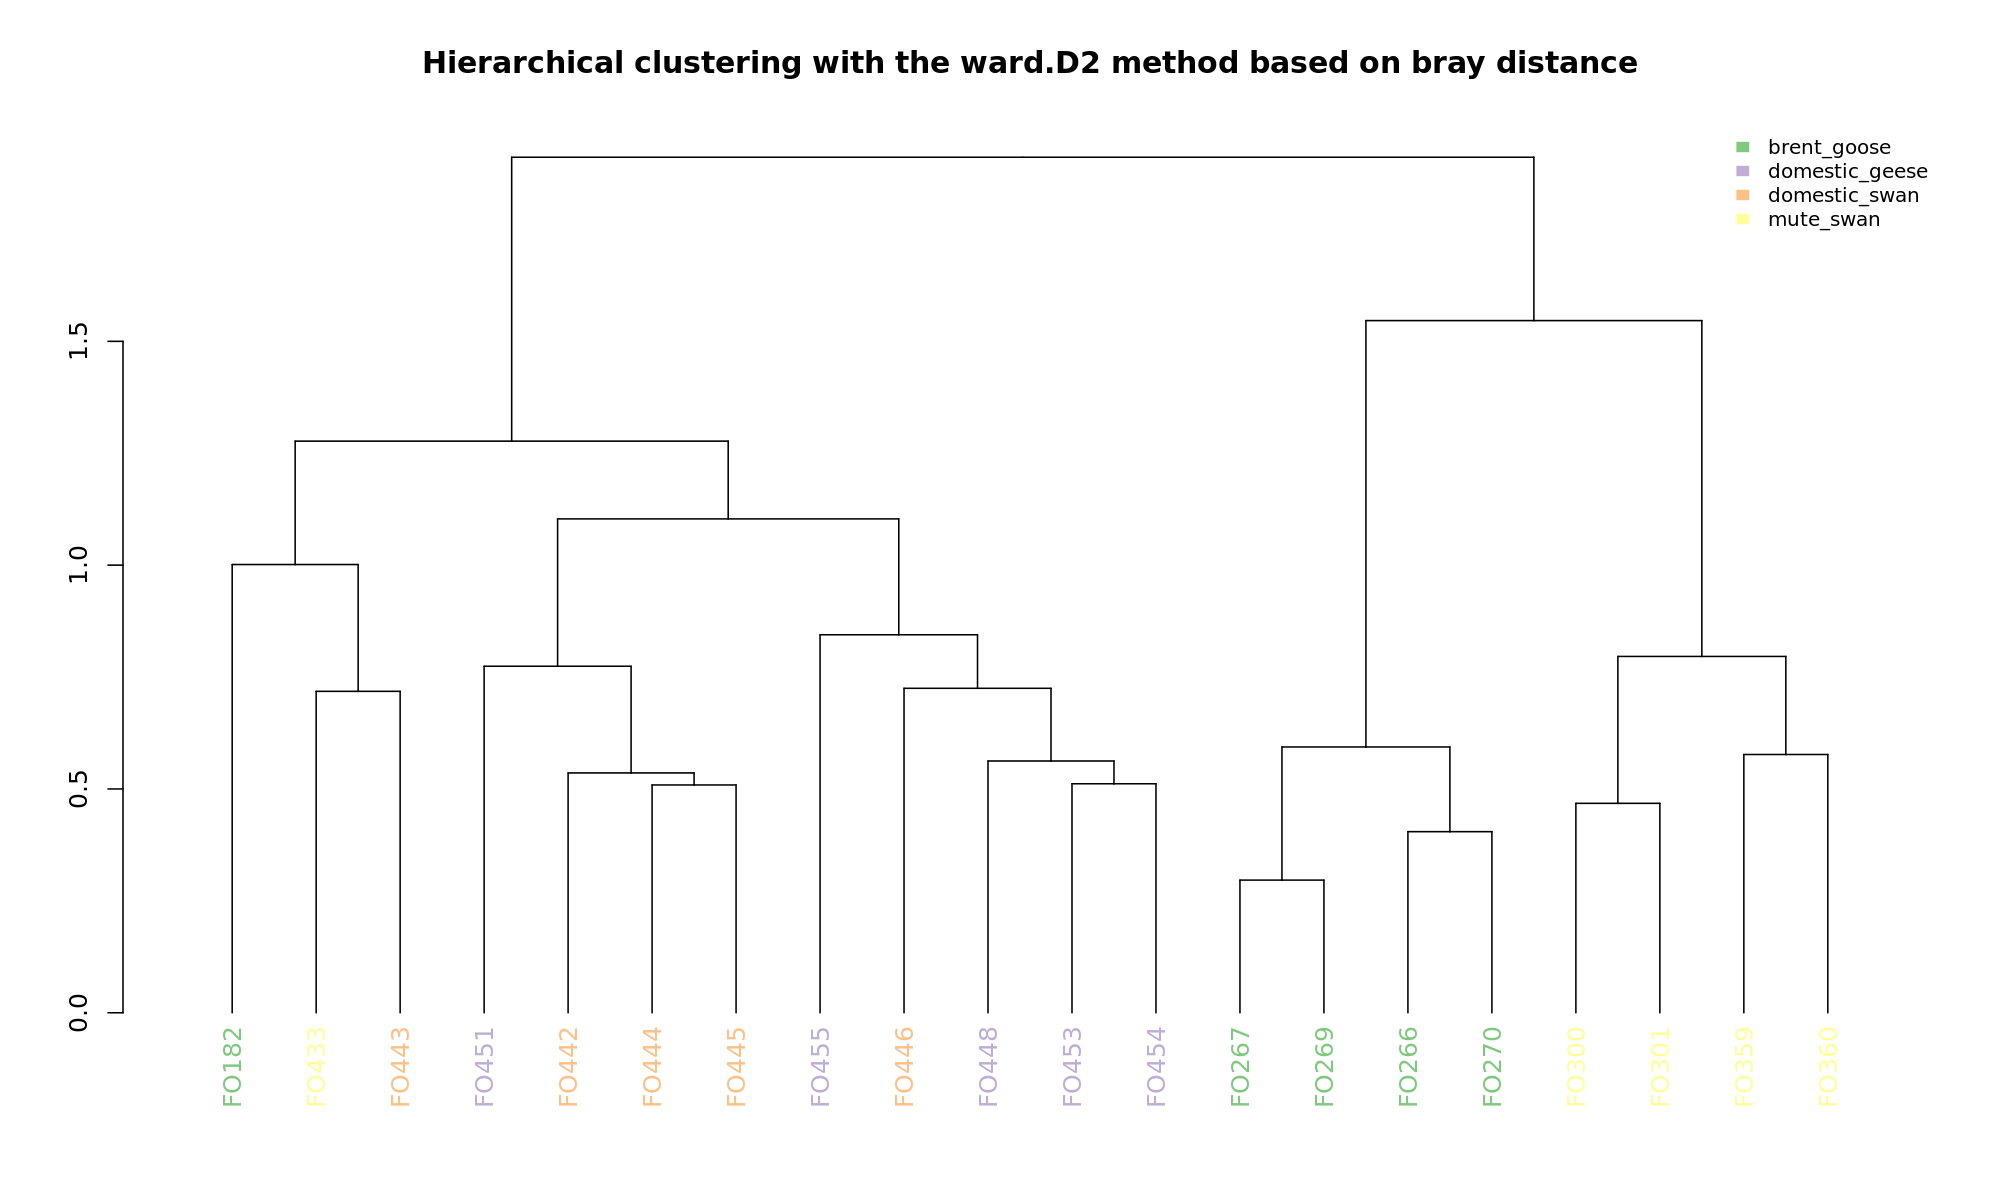
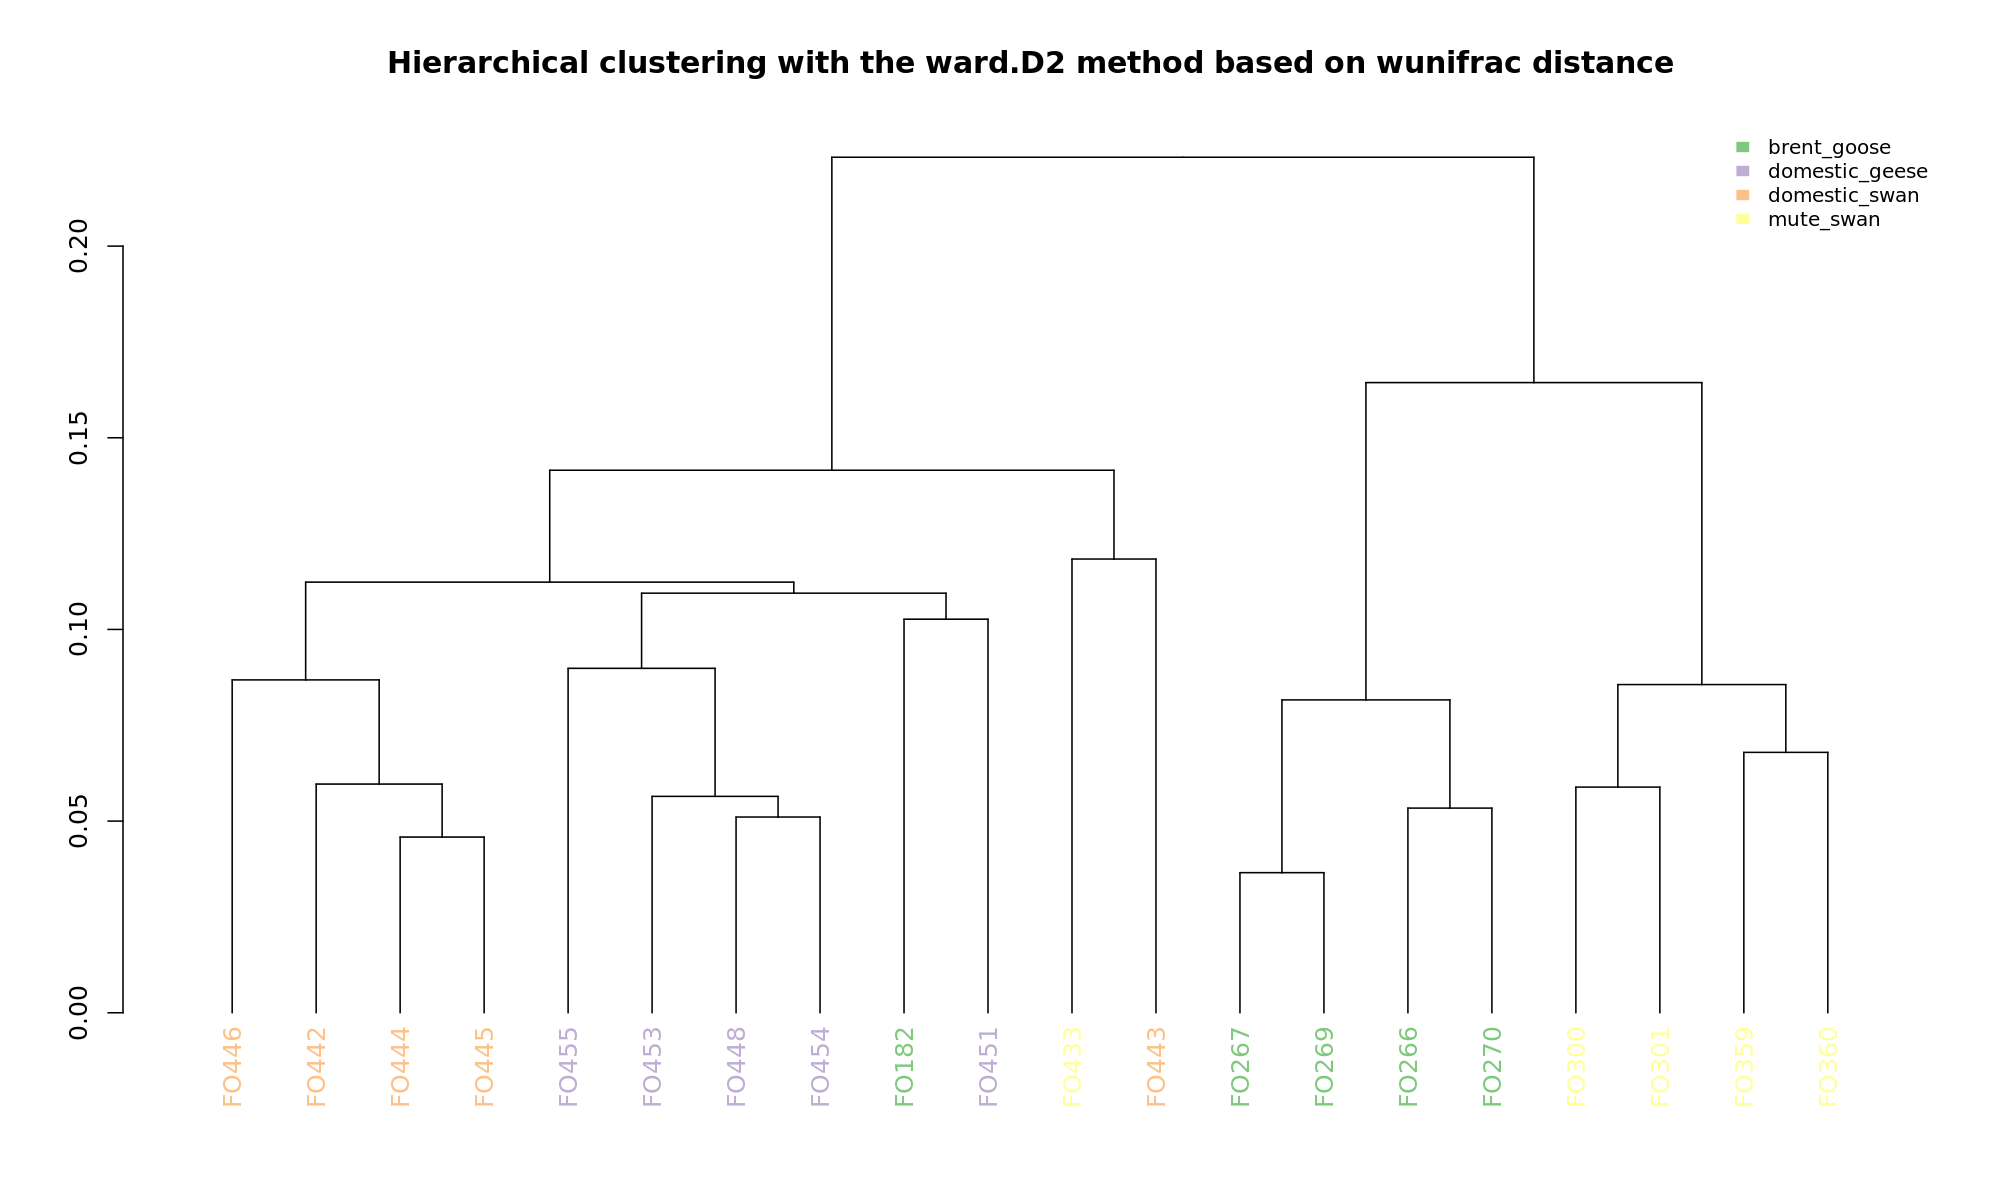
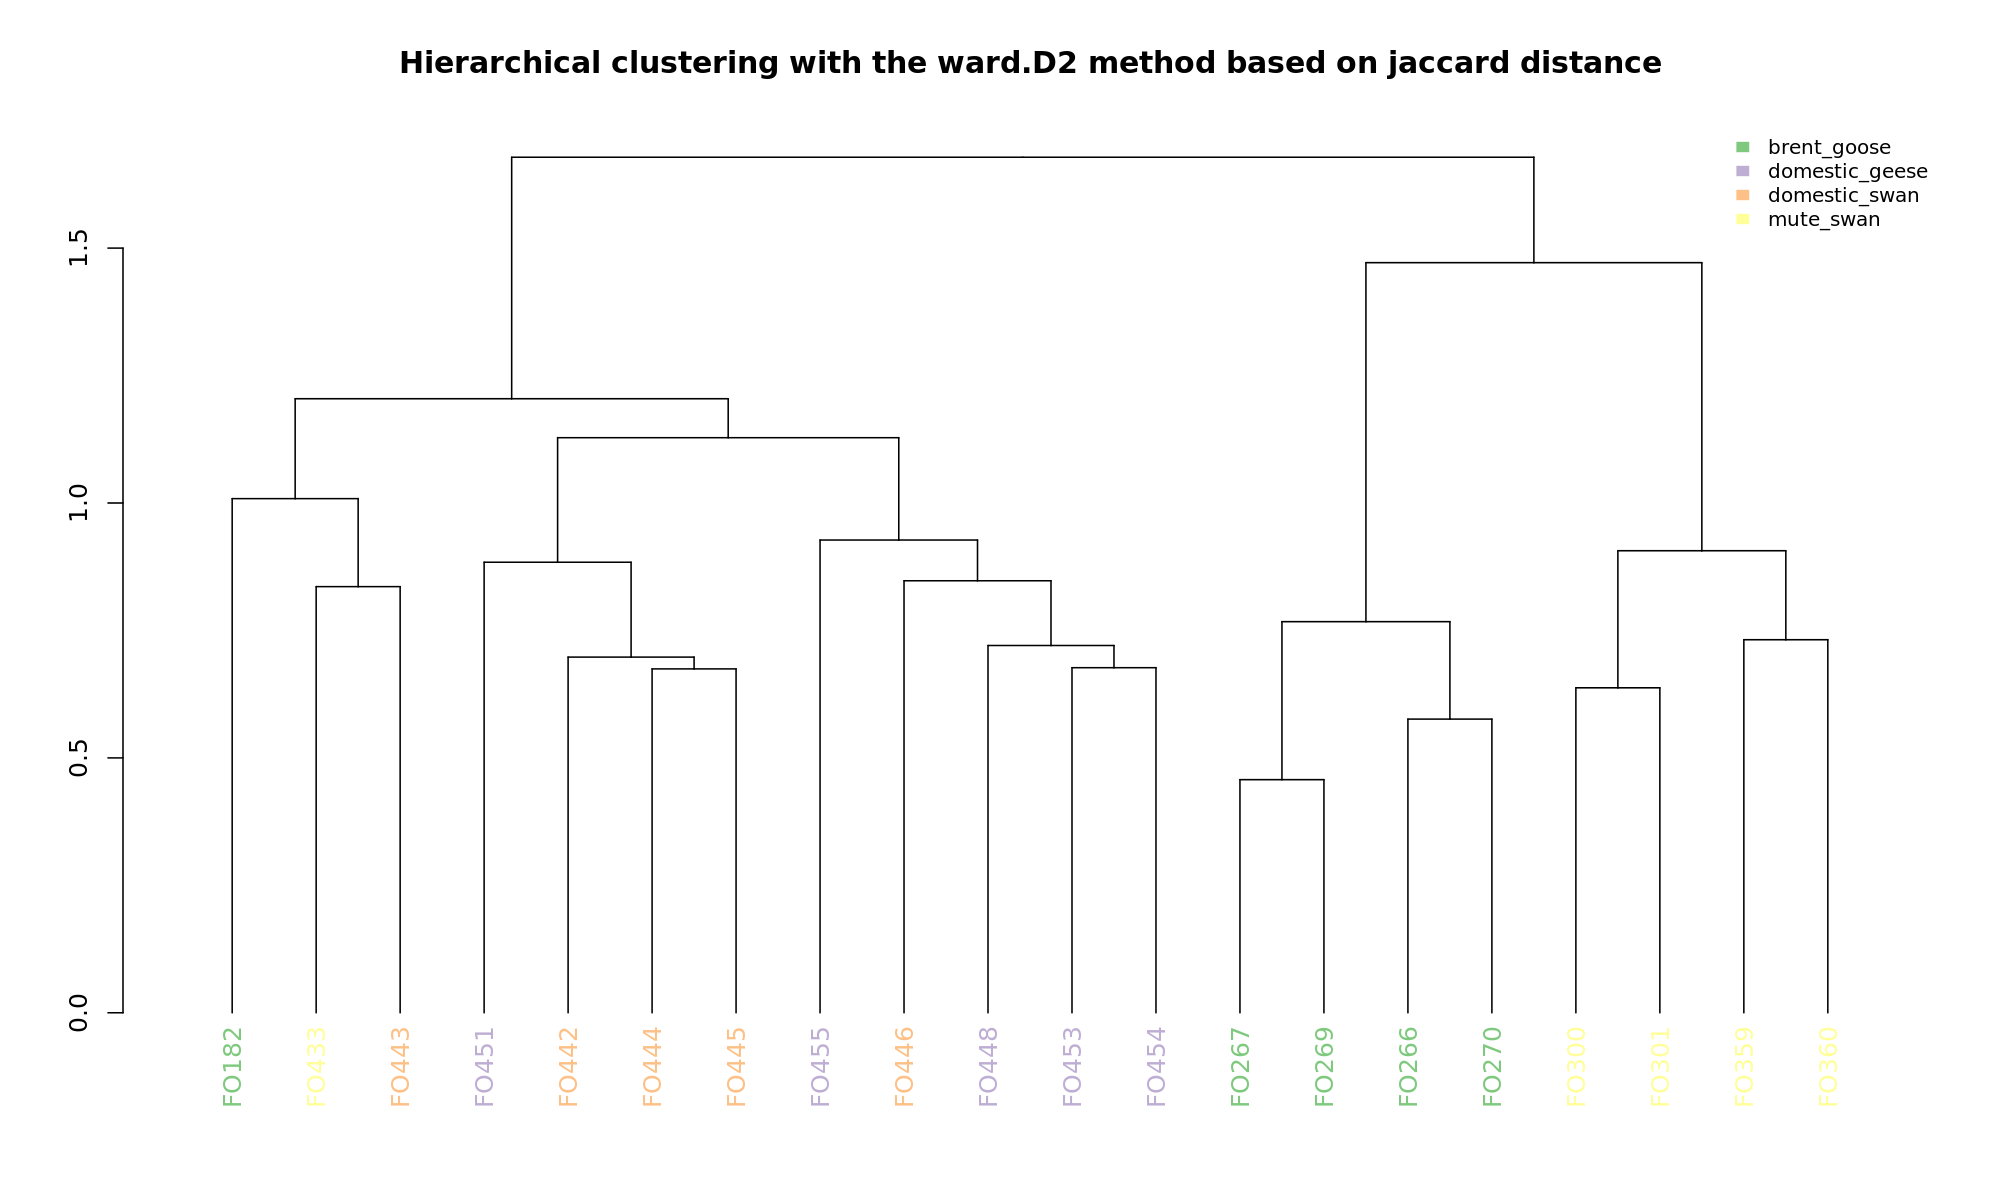
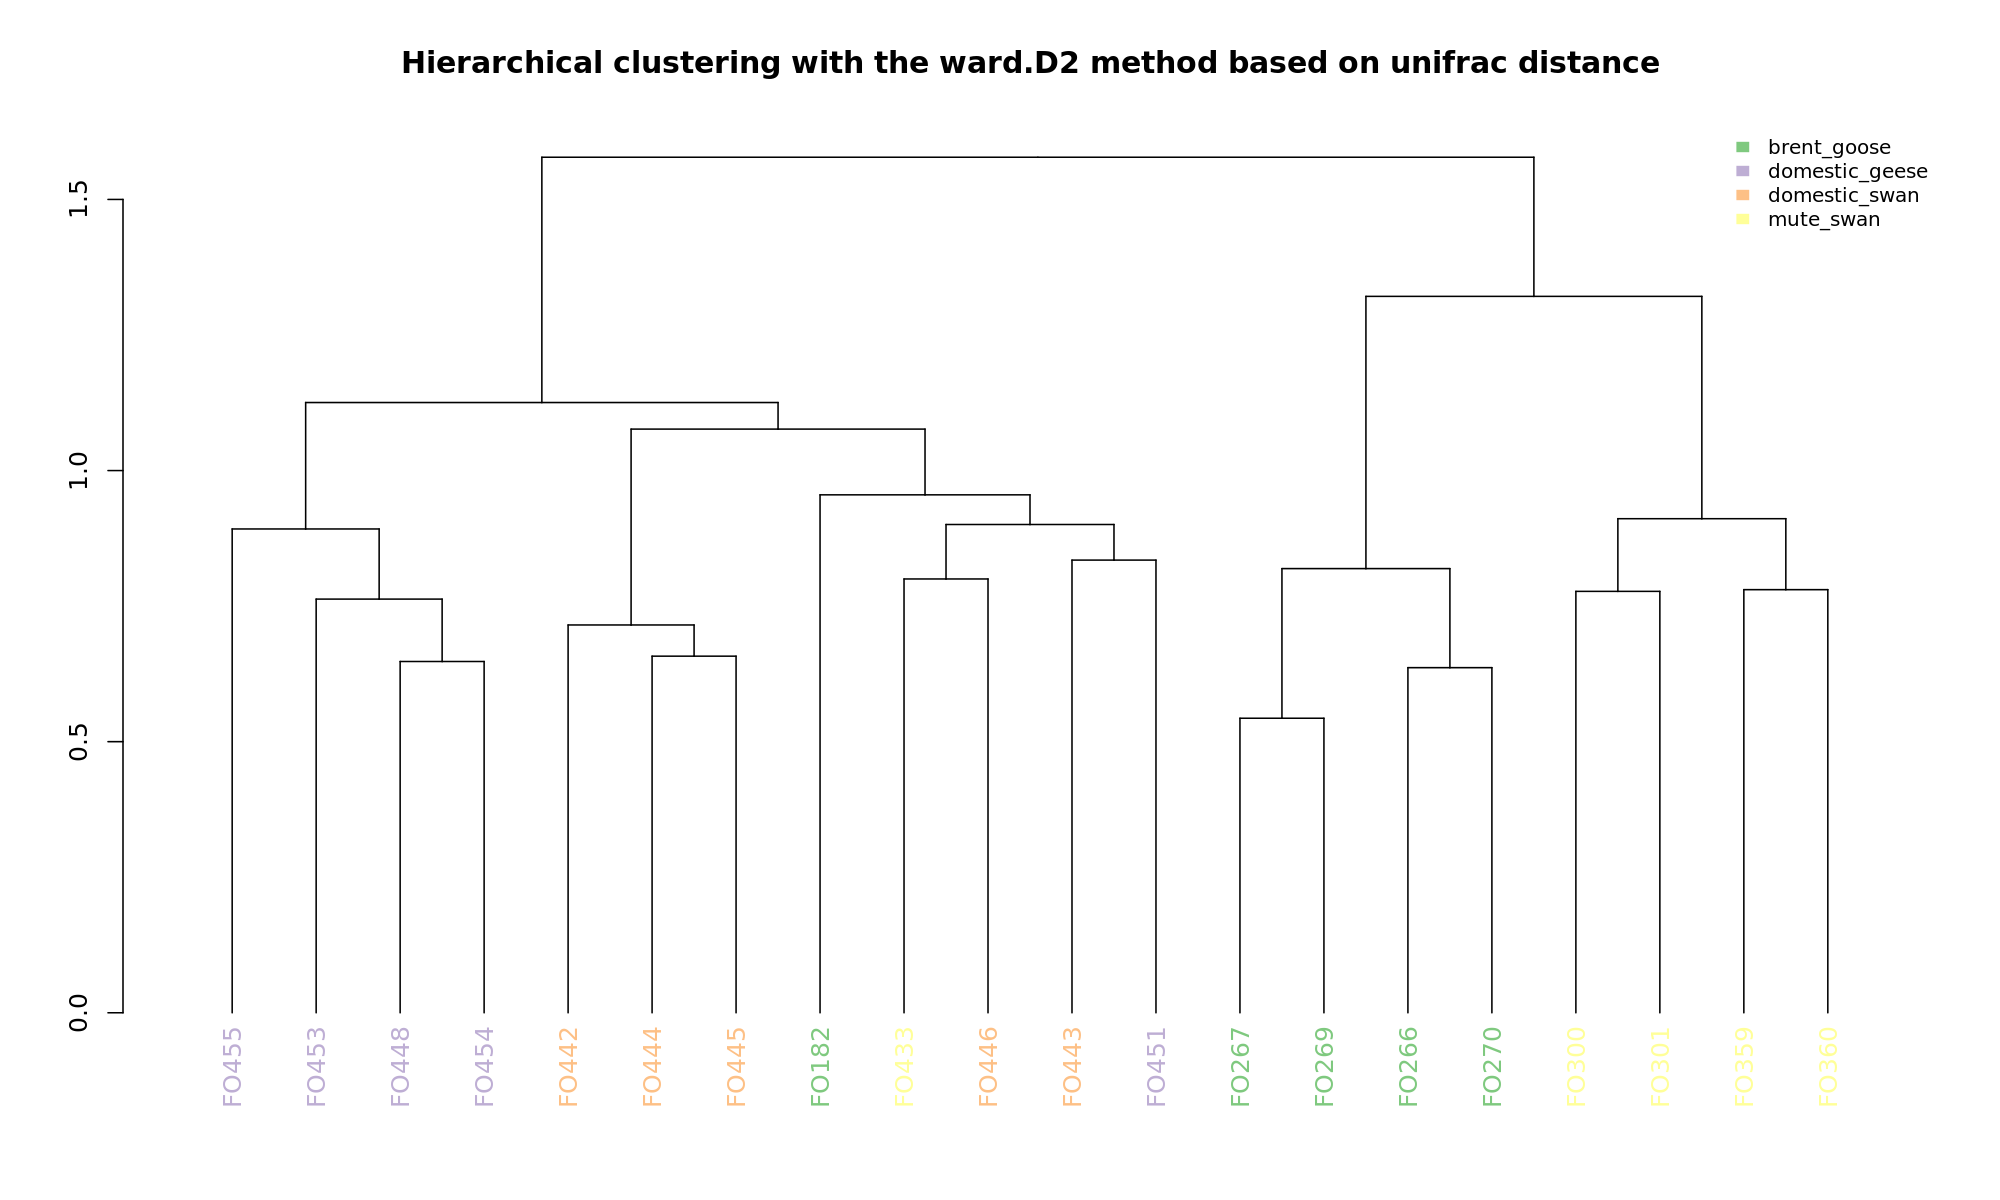
NMDS
PCoA
hclustering
Explained variance
Descriptive comparison [optional]
- sample_species
- source
About
Contributors
SAMBA is developped by Ifremer's Bioinformatics Core Facility (SeBiMER)
(French Research Institute for Exploitation of the Sea).
Citations
You can cite the NextFlow publication as follows:
Paolo Di Tommaso, Maria Chatzou, Evan W. Floden, Pablo Prieto Barja, Emilio Palumbo & Cedric Notredame. (2017).
Nextflow enables reproducible computational workflows.
Nature biotechnology. 35(4), 316-319.
You can cite each tool used in SAMBA as follows:
Benjamin J. Callahan, Paul J. McMurdie, Michael J. Rosen, Andrew W. Han, Amy Jo A. Johnson & Susan P. Holmes. (2016).
DADA2: high-resolution sample inference from Illumina amplicon data
Nature methods. 13(7), 581.
Donald T. McKnight, Roger Huerlimann, Deborah S. Bower, Lin Schwarzkopf, Ross A. Alford & Kyall R. Zenger. (2019).
microDecon: A highly accurate read‐subtraction tool
for the post‐sequencing removal of contamination in metabarcoding studies. Environmental DNA. 1(1), 14-25.
Evan Bolyen, Jai Ram Rideout, Matthew R. Dillon, Nicholas A. Bokulich, Christian C. Abnet, Gabriel A. Al-Ghalith, Harriet Alexander, Eric J. Alm,
Manimozhiyan Arumugam, Francesco Asnicar, Yang Bai, Jordan E. Bisanz, Kyle Bittinger, Asker Brejnrod, Colin J. Brislawn, C. Titus Brown, Benjamin J. Callahan,
Andrés Mauricio Caraballo-Rodríguez, John Chase, Emily K. Cope, Ricardo Da Silva, Christian Diener, Pieter C. Dorrestein, Gavin M. Douglas, Daniel M. Durall,
Claire Duvallet, Christian F. Edwardson, Madeleine Ernst, Mehrbod Estaki, Jennifer Fouquier, Julia M. Gauglitz, Sean M. Gibbons, Deanna L. Gibson, Antonio Gonzalez,
Kestrel Gorlick, Jiarong Guo, Benjamin Hillmann, Susan Holmes, Hannes Holste, Curtis Huttenhower, Gavin A. Huttley, Stefan Janssen, Alan K. Jarmusch, Lingjing Jiang,
Benjamin D. Kaehler, Kyo Bin Kang, Christopher R. Keefe, Paul Keim, Scott T. Kelley, Dan Knights, Irina Koester, Tomasz Kosciolek, Jorden Kreps, Morgan G. I. Langille,
Joslynn Lee, Ruth Ley, Yong-Xin Liu, Erikka Loftfield, Catherine Lozupone, Massoud Maher, Clarisse Marotz, Bryan D. Martin, Daniel McDonald, Lauren J. McIver,
Alexey V. Melnik, Jessica L. Metcalf, Sydney C. Morgan, Jamie T. Morton, Ahmad Turan Naimey, Jose A. Navas-Molina, Louis Felix Nothias, Stephanie B. Orchanian,
Talima Pearson, Samuel L. Peoples, Daniel Petras, Mary Lai Preuss, Elmar Pruesse, Lasse Buur Rasmussen, Adam Rivers, Michael S. Robeson II, Patrick Rosenthal, Nicola Segata,
Michael Shaffer, Arron Shiffer, Rashmi Sinha, Se Jin Song, John R. Spear, Austin D. Swafford, Luke R. Thompson, Pedro J. Torres, Pauline Trinh, Anupriya Tripathi,
Peter J. Turnbaugh, Sabah Ul-Hasan, Justin J. J. van der Hooft, Fernando Vargas, Yoshiki Vázquez-Baeza, Emily Vogtmann, Max von Hippel, William Walters, Yunhu Wan,
Mingxun Wang, Jonathan Warren, Kyle C. Weber, Charles H. D. Williamson, Amy D. Willis, Zhenjiang Zech Xu, Jesse R. Zaneveld, Yilong Zhang, Qiyun Zhu, Rob Knight
& J. Gregory Caporaso. (2019). Reproducible, interactive, scalable and
extensible microbiome data science using QIIME 2. Nature biotechnology. 37(8), 852-857.
Gavin M. Douglas, Vincent J. Maffei, Jesse Zaneveld, Svetlana N. Yurgel, James R. Brown, Christopher M. Taylor, Curtis Huttenhower & Morgan G. I. Langille. (2019).
PICRUSt2: An improved and extensible approach for metagenome inference.
BioRxiv. 672295.
Marcel Martin. (2011). Cutadapt removes adapter
sequences from high-throughput sequencing reads. EMBnet. journal. 17(1), 10-12.
R Core Team. (2020). R: A language and environment for statistical computing.
R Foundation for Statistical Computing, Vienna, Austria.
Scott W. Olesen, Claire Duvallet & Eric J. Alm. (2017). dbOTU3:
A new implementation of distribution-based OTU calling. PloS one. 12(5).
Siddhartha Mandal, Will Van Treuren, Richard A. White, Merete Eggesbø, Rob Knight & Shyamal D. Peddada. (2015).
Analysis of composition of microbiomes: a novel method for studying microbial composition.
Microbial ecology in health and disease, 26(1), 27663.
